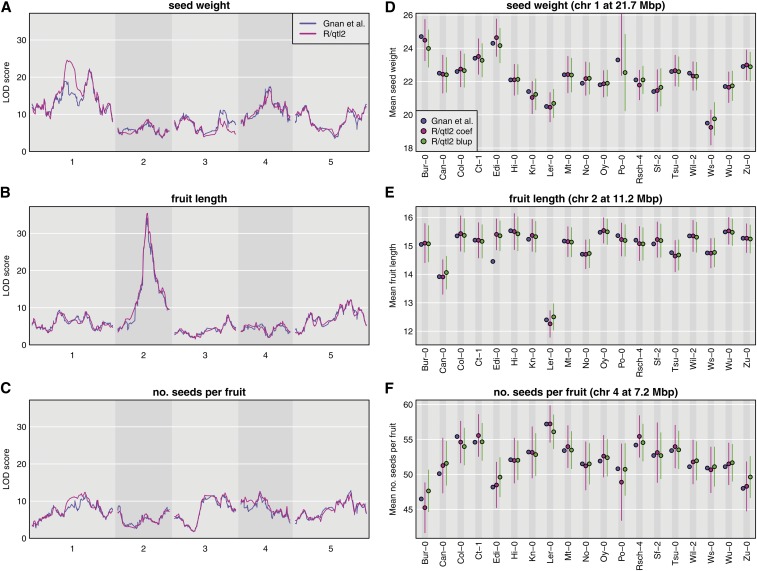
Figure 2.
Analysis of 19-way Arabidopsis MAGIC data from Gnan et al. (2014) for three traits. (A–C) LOD curves with the results from Gnan et al. (2014) in blue, and from R/qtl2 in pink. (D–F) QTL effects from Table 5 of Gnan et al. (2014) (blue), by linear regression from R/qtl2 (pink), and BLUPs from R/qtl2 (green).

