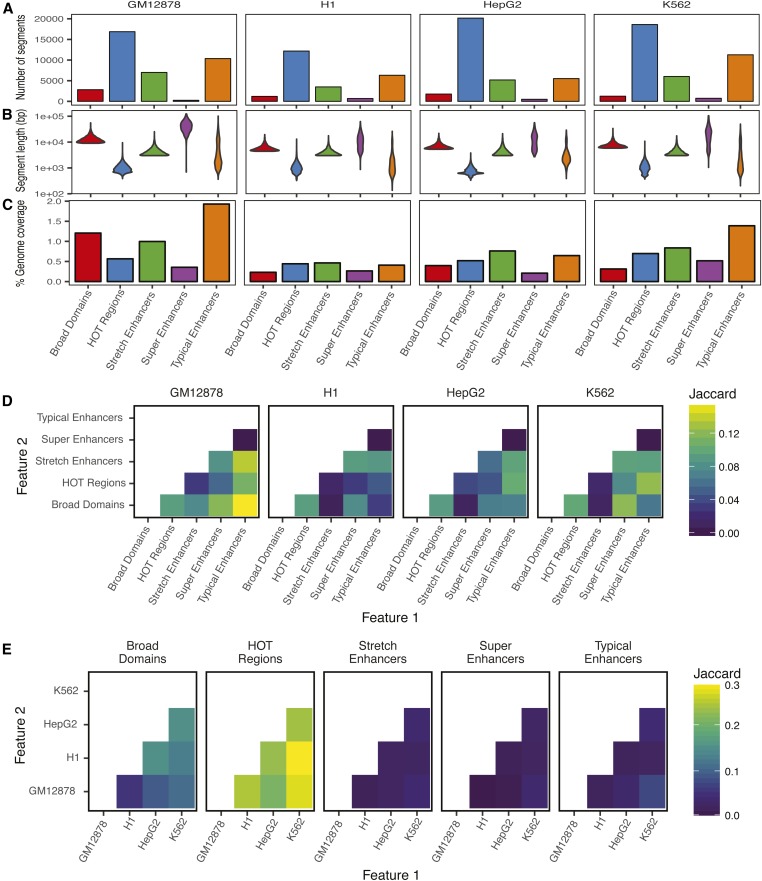
Figure 2.
Summary statistics and overlaps demonstrate differences in characteristics of regulatory annotations. For each annotation in each cell type considered, shown are number of annotation segments (A), length distribution of segment annotations (B), and percent genomic coverage (C). Jaccard statistic (base pair-level intersection/union) between each pair of annotations is shown within a cell type (D) and across cell types (E). HOT, high-occupancy target.

