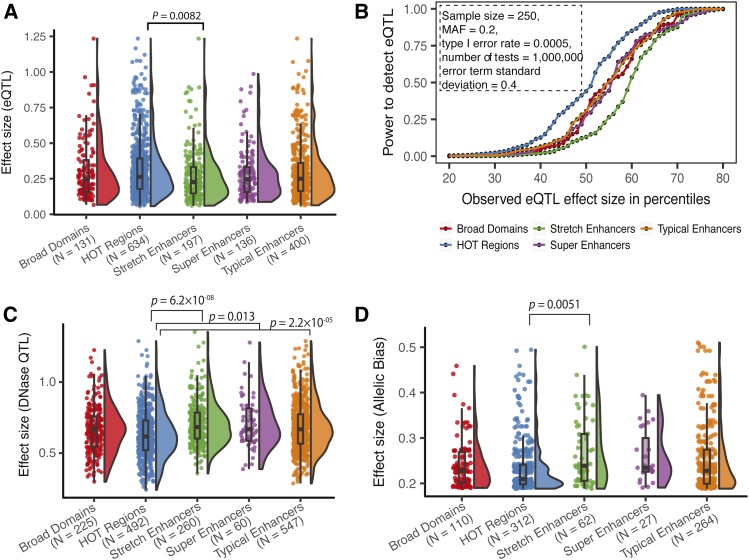
Figure 5.
Gene expression and chromatin QTL effect size differences in regulatory annotations suggest regulatory buffering. (A) Distribution of eQTL effect sizes for blood eQTL (GTEx v7, 10% FDR) in K562 regulatory annotations. (B) Power to detect eQTL after Bonferroni correction at effect sizes corresponding with the 10th through the 90th percentile observed for each annotation [shown in (A)]. Other constant parameters for the power calculation are shown in box. (C) Distribution of effect sizes for LCL DNase QTL in GM12878 regulatory annotations. (D) Distribution of effect sizes (deviation from expectation) for SNPs with significant allelic bias in GM12878 ATAC-seq (P < 0.05, minimum coverage at SNP = 30, reads downsampled to 30, see Materials and Methods) in GM12878 regulatory annotations. P-values from Wilcoxon rank sum tests, after a Bonferroni correction accounting for 10 pairwise tests. Number of QTL/allelic biased SNPs overlapping each regulatory annotation is shown in parentheses in (A, C, and D). ATAC-seq, Assay for transposase accessible chromatin-sequencing; eQTL, expression quantitative trait loci; FDR, false discovery rate; HOT, high-occupancy target; LCL, lymphoblastoid cell line; MAF, minor allele frequency.

