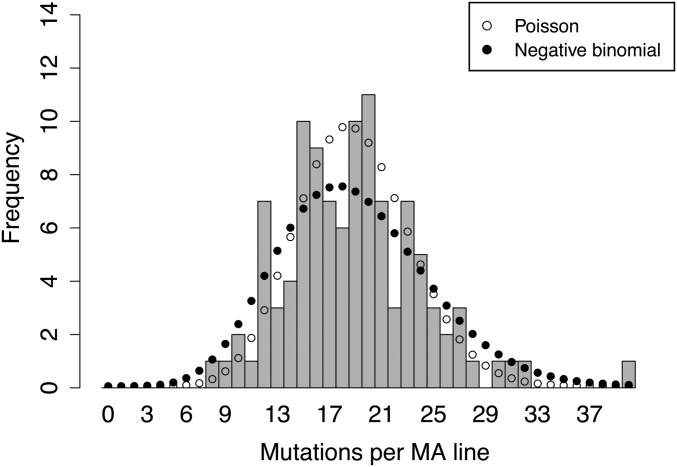
Figure 1.
Distribution of SNM numbers in each of the 107 A. thaliana MA lines. The expected numbers for best-fit Poisson (lambda = 18.9) and negative binomial (mean = 18.9, overdispersion = 1.74) distributions are shown as open and closed circles, respectively. The distribution of SNMs per MA line fits both negative binomial (χ2 = 10.4, d.f. = 13, P = 0.66) and Poisson distributions (χ2 = 14.0, d.f. = 13, P = 0.38). For chi-square analysis, bins with few counts were combined so that every bin has at least five counts. The distribution includes 1694 unique and 159 shared SNMs.

