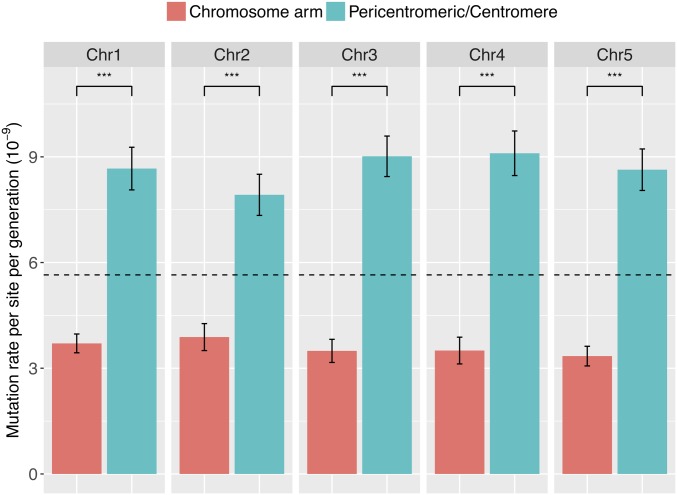
Figure 2.
Comparison of mutation rates between chromosome arms and pericentromeric/centromere regions in 107 MA lines. The base mutation rate for chromosome arms is significantly lower than pericentromeric/centromere regions across five chromosomes (χ2 = 567.4, d.f. = 2, P < 2e−16). Dashed line indicates genome-wide average. The pericentromeric region is defined as being within 4 Mb of the centromere. Error bar is equal to one SEM. Asterisks indicate P < 0.001 (***). Mutation rates are adjusted for accessible reference genome of respective regions that pass the filtering threshold.

