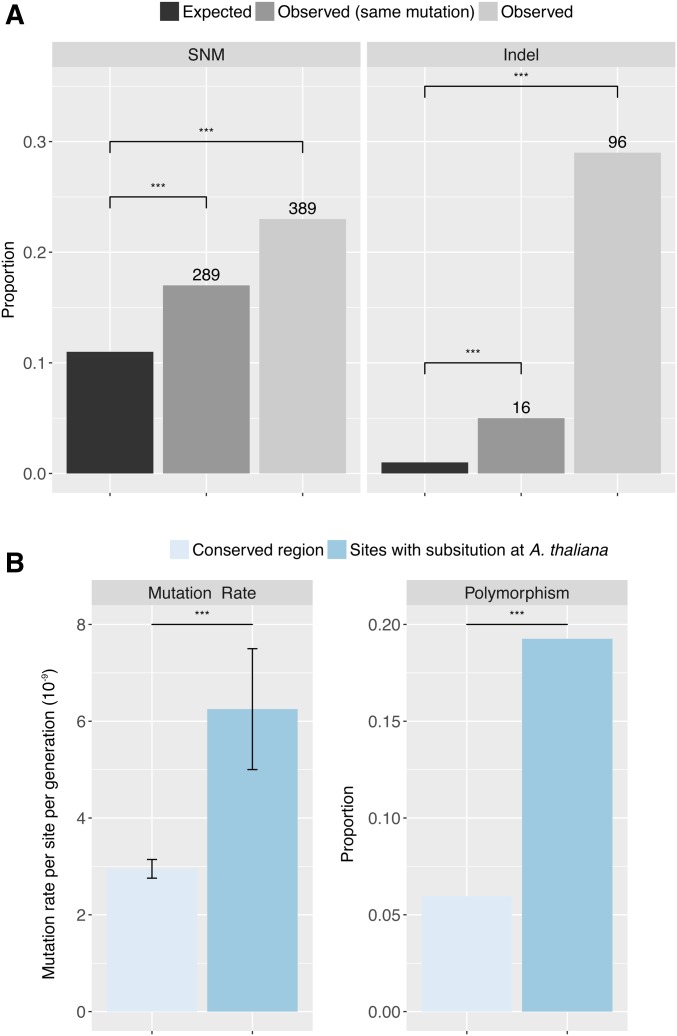
Figure 5.
Overlap between mutations identified in 107 MA lines (SNMs) and polymorphism detected in the 1001 Genomes population (SNPs). (A) Comparison of expected and observed proportions of SNMs and indels that overlap with biallelic SNPs and indels in the 1001 Genomes population. Numbers on top of each bar indicate absolute overlap. (B) Comparison of mutation rates and proportions of polymorphism at conserved sites (identical in C. rubella, A. lyrata, and the A. thaliana reference genome) and at sites with substitutions in the A. thaliana Col-0 reference genome. The proportion of polymorphism is calculated as the number of biallelic SNPs divided by the number of reference sites. Asterisks indicate P < 0.001 (***) of Fisher’s Exact test following sequential Bonferroni correction.

