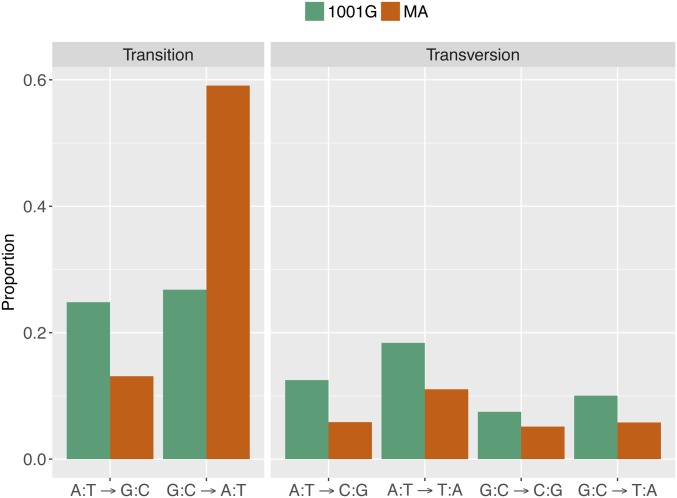
Figure 6.
Comparison of nucleotide changes in 107 MA lines (brown bars) and the 1001 Genomes population (green bars). Complementary mutations, such as A:T→G:C and T:A→C:G, are collapsed. The distribution of nucleotide changes in MA lines is significantly different from the polymorphisms discovered in the 1001 Genomes Project (χ2 = 431.4, d.f. = 5, P < 2e−16).

