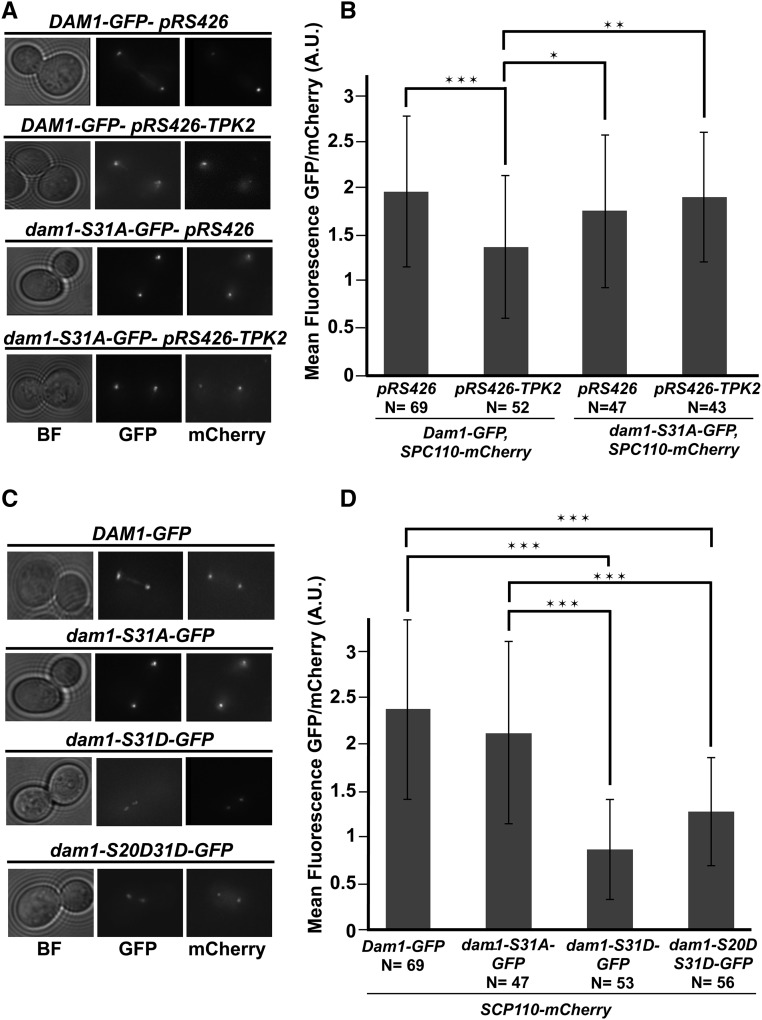
Figure 4.
Phosphorylation of S31 is associated with a reduction in Dam1p at the kinetochore. (A) Wild-type strains Dam1p-GFP, Spc110p-mCherry (JCY1041) and nonphosphorylatable dam1p-S31A-GFP, Spc110p-mCherry (JCY1042) strains carrying 2 µm empty vectors, pRS426 (JCB63), or high-copy TPK2, pRS426-TPK2 (JCB59) were grown in SC-URA and imaged. Images of GFP and mCherry are the maximum intensity projections of Z-sections of the stacks onto a single plane. (B) Measurements for the mean fluorescence intensity of Dam1p-GFP or dam1p-S31A-GFP normalized to Spc110p-mCherry are plotted. (C) Strains expressing wild-type Dam1p-GFP (JCY1041), Spc110p-mCherry, nonphosphorylatable dam1p-S31A-GFP (JCY1042), Spc110p-mCherry, single phospho-mimetic dam1p-S31D-GFP, Spc110p-mCherry (JCY1043), or double phospho-mimetic dam1p-S20DS31D-GFP (JCY1045) were grown in SC media and imaged. Images of GFP and mCherry are the maximum intensity projections of Z-sections of the stacks onto a single plane. (D) As in B, measurements for the mean fluorescence intensity of GFP normalized to Spc110p-mCherry are plotted. In all cases, fresh cultures were started with a 1:10 dilution from an overnight culture at 25° and allowed to grow for ∼3–4 hr at 34° before imaging by fluorescence microscopy. Z-stacks were taken with a DeltaVision Elite microscope (60× objective lens, 1.4 NA). Quantification of GFP foci normalized to mCherry were measured for large budded cells that have clearly separated GFP signals using Fiji software. Number of cells counted indicated by (N). Plotted is the mean intensity GFP/mCherry ratio (B and D) and error bars represent the SD. * P < 0.01, ** P < 0.001,*** P < 0.0001, as calculated using Student’s t-test. BF, bright field; GFP, Dam1p-GFP (and mutants); mCherry, Spc110p-mCherry.

