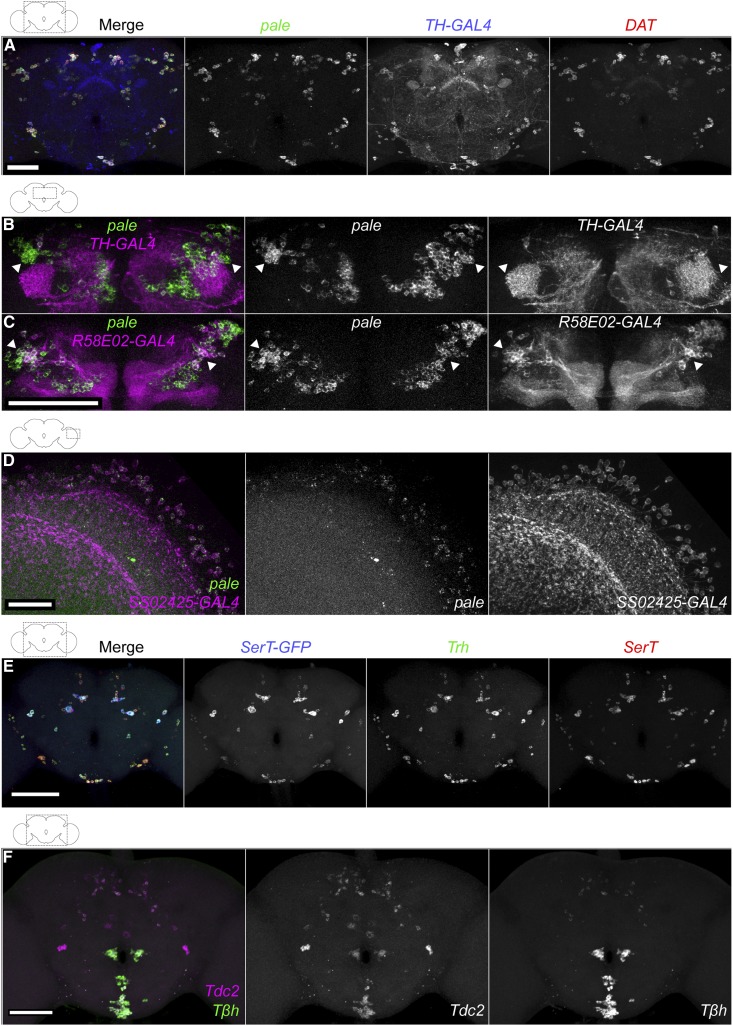
Figure 2.
Validation of FISH probes for identification of dopaminergic, serotoninergic, tyraminergic, and octopaminergic neurons. (A) Simultaneous detection of pale and DAT mRNAs with TH-GAL4. A TH-GAL4; UAS-HaloTag brain was labeled with ATTO 647N HaloTag ligand (blue), and FISH probes for pale (Quasar 570; green) and DAT (CAL Fluor 610 Red; magenta) mRNAs, shown together (left) and as individual grayscale images. Samples were processed using microcentrifuge protocol. Bar, 50 μm. (B and C) pale and GAL4 marker expression in the dorsal anterior brain, focusing on neurons of the protocerebral anterior medial cluster. In TH-GAL4 (B) and R58E02-GAL4 (C), UAS-HaloTag brains were labeled with AF488 HaloTag ligand (magenta) and pale FISH probe (Cy5; green), shown together (left) and as individual grayscale images. Images are maximum intensity z-projections through the anterior central brain. Arrowheads indicate neurons without overlap in (B) and neurons with overlap in (C). Bar, 50 μm. Movies of (B and C) are in Files S8 and S9, respectively. (D) pale expression in Mi15 medulla neurons. An SS02425-GAL4, UAS-HaloTag brain was labeled with ATTO 647N HaloTag ligand (magenta) and pale FISH probe (Quasar 570; green) together (left) or as individual grayscale images (Davis et al. 2018). Bar, 20 μm. (E) A SerT-GFP brain was labeled with FISH probes for GFP (AF488; blue), Trh (Cy3; green), and SerT (Cy5; red) mRNAs. Each channel is shown in gray on the right. Bar, 100 μm. (F) Simultaneous detection of Tdc2 and Tβh mRNAs. A wild-type brain was labeled with FISH probes for Tdc2 (Cy5; magenta) and Tβh (Cy3; green). The channels are shown to the right in gray. Bar, 50 μm. Movie is in File S11. The overlap of Tdc2 and Tβh FISH probes with Tdc2-GAL4 is shown in Figure S3C.

