Figure 3.
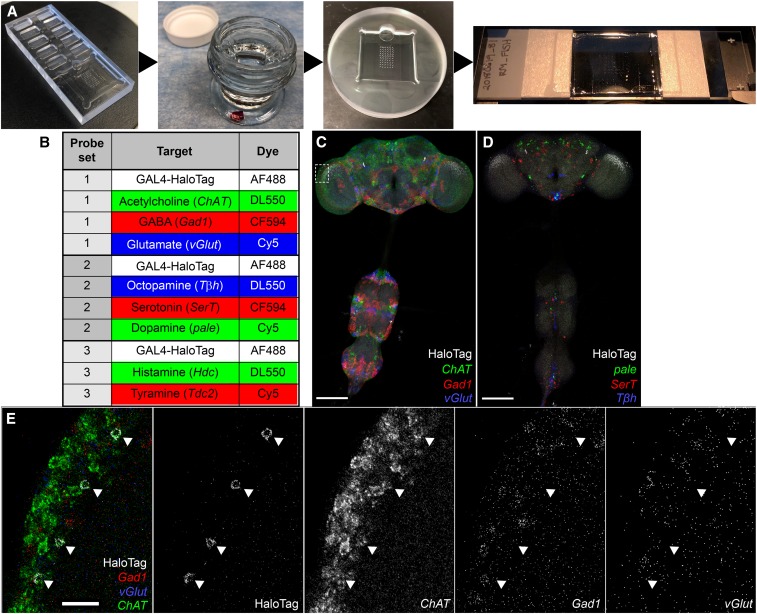
High-throughput FISH platform for identifying neurotransmitter phenotypes in Drosophila CNS. (A) Key steps and equipment of the high-throughput FISH platform. Samples are mounted on a coverslip using a plexiglass mounting T-dish (see Materials and Methods), using the printed grid beneath the coverslip as a guide. Most processing steps occur by moving coverslips between jars of solution. Hybridization is carried out with the coverslip resting on spacers to either side of a custom hybridization chamber, trapping ∼150 μl of hybridization solution with the samples between the coverslip and the bottom of the chamber. For imaging, the coverslip is mounted in distyrene, plasticizer, and xylene on a slide with a split coverslip for spacers. A schematic of the hybridization chamber is shown in Figure S5A. (B) Neurotransmitter marker detection with optimized FISH probe sets and fluorophore selection. Each set permits detection of two or three FISH probes together with a HaloTag reporter. Movies of optimized probe sets without HaloTag reporter are in Files S1–S6. (C–E) Neurotransmitter detection using the FISH platform. Identifying the neurotransmitter phenotypes of a population of medulla neurons. SS02565, UAS-HaloTag brains were labeled with AF488 HaloTag ligand (white) and (C) FISH probes for Gad1 (CF594; red), vGlut (Cy5; blue), and ChAT (DL550; green) mRNAs or (D) SerT (CF594; red), pale (Cy5; blue), and Tβh (DL550; green) mRNAs. Bar, 100 μm. (E) Boxed region from (C) was imaged with a 63× objective. Individual channels are shown to the right in gray. Arrowheads indicate the location of HaloTag-labeled cell bodies. Movie is in File S7. Bar, 10 μm.

