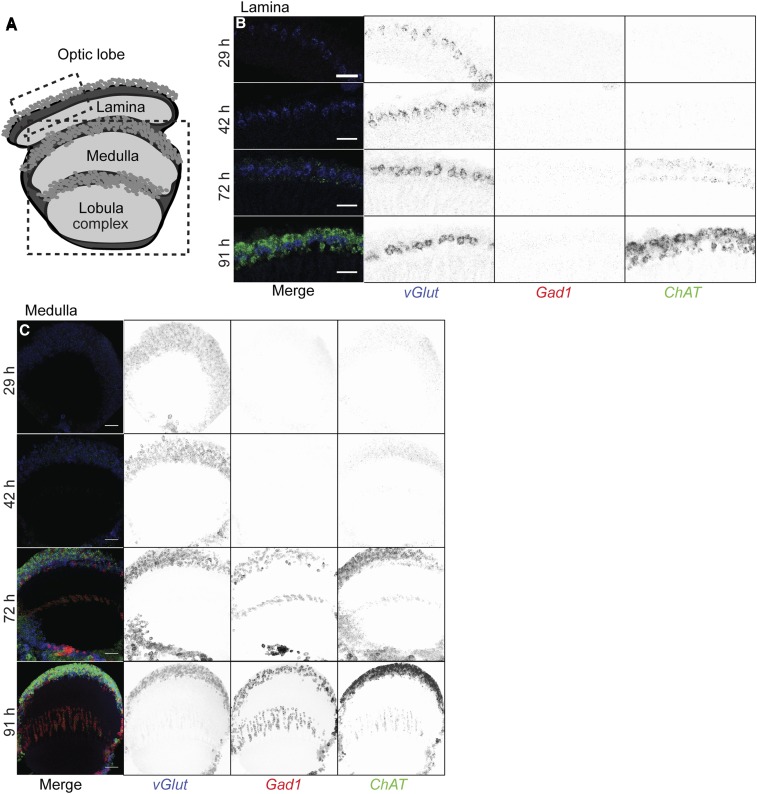
Figure 4.
Developmental time course of vGlut, Gad1 and ChAT expression in the optic lobe. (A) Schematics of optic lobe subregions. Boxes indicate approximate region of the lamina and medulla imaged. (B and C) Distribution of vGlut (Cy5; blue), Gad1 (CF594; red), and ChAT (DL550; green) transcripts in the lamina (B) or medulla (C) at different developmental stages (hours after puparium formation at 25°). Lamina images (B) show single 63× confocal sections. Bar, 20 µm. Medulla images (C) are maximum intensity projections through 25 z-planes for a total depth of 20 µm. Merged images are shown to the left, with split channels inverted in gray to the right. Bar, 10 µm.

