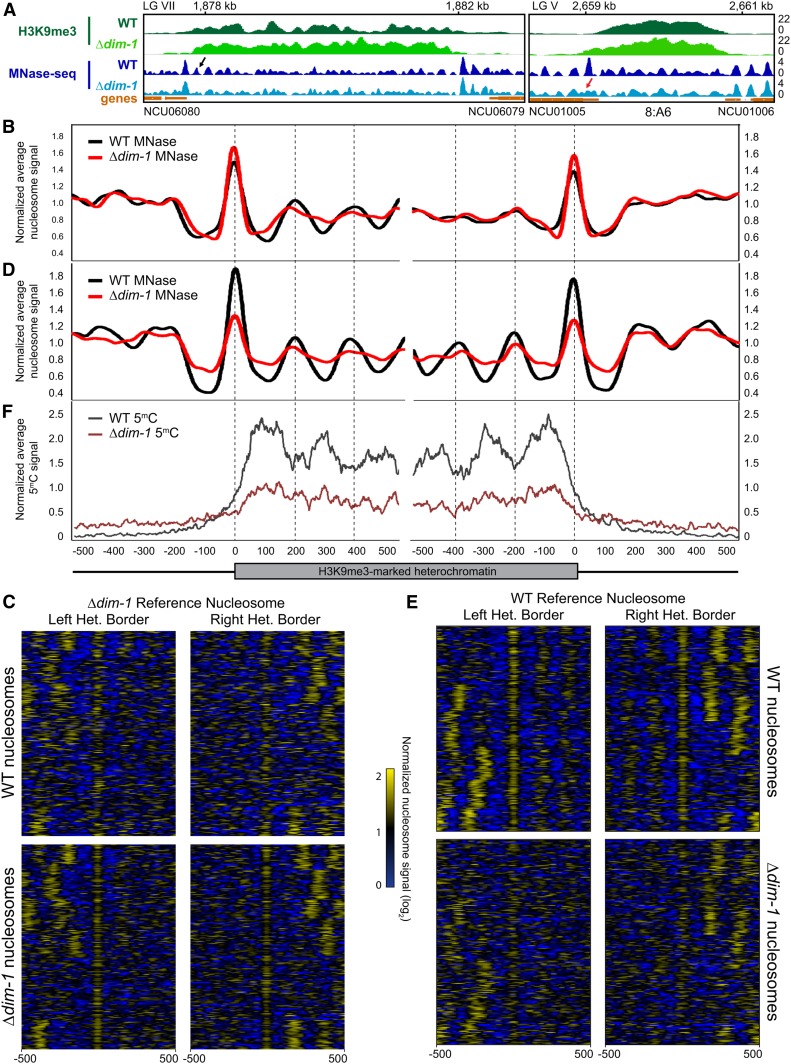
Figure 4.
Constitutive heterochromatic regions exhibit nucleosome disorder, especially in Δdim-1 strains. (A) Representative examples of nucleosome positioning within constitutive heterochromatin. H3K9me3 ChIP-sequencing (green) and MNase-sequencing (blue) tracks of WT and Δdim-1 strains are shown for a region on LG VII between NCU06080 and NCU06079 and the 8:A6 region on LG V (Selker et al. 2003). The black arrow denotes an internal nucleosome that has periodicity in the WT strain while the red arrow denotes a border nucleosome that becomes disordered in the ?dim-1 strain. (B) Average mono-nucleosome enrichment profiles of MNase-sequencing data (MNase) in WT and Δdim-1 strains at the left and right borders (relative to the left telomere) of constitutive heterochromatic regions longer than at least 1000 base pairs aligned from the first nucleosome peak completely covered by H3K9me3 in Δdim-1 strains. (C) Nucleosome peak signal heatmaps from WT and Δdim-1 strains normalized to the average enrichment signal. Data are shown for ±500 bp for the left and right heterochromatic region borders (n = 210) relative to the first heterochromatic nucleosome peak in Δdim-1 strains. Heterochromatic regions are identically ordered in each heatmap group. (D) Average mono-nucleosome enrichment profiles of MNase-sequencing data (MNase) in WT and Δdim-1 strains at the left and right borders, as in B. Vertical dashed lines mark the apices of WT nucleosome signals. (E) Nucleosome peak signal heatmaps from WT and Δdim-1 strains normalized to the average enrichment signal, as in C, relative to the first heterochromatic nucleosome peak in WT strains. (F) Average enrichment profiles of bisulfite-sequencing showing enrichment of cytosine methylation in WT and Δdim-1 strains at the left and right borders of constitutive heterochromatic regions.

