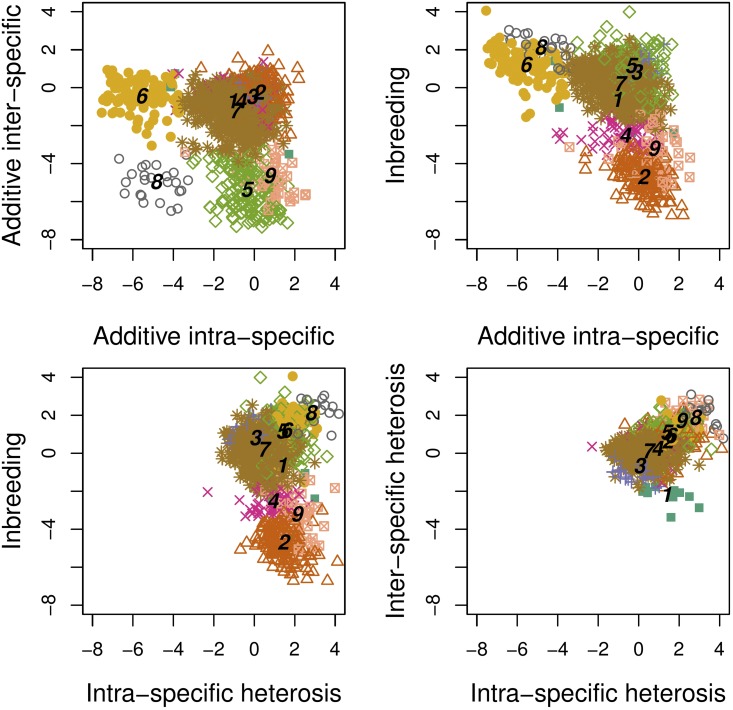
Figure 3.
Patterns of correlations between genetic variance components of protein abundances. Points correspond to proteins, type and color combinations identify the clusters obtained by their classification based on a Gaussian mixture model. Numbers from 1 to 9 identify class centers for each cluster.

