Figure 6.
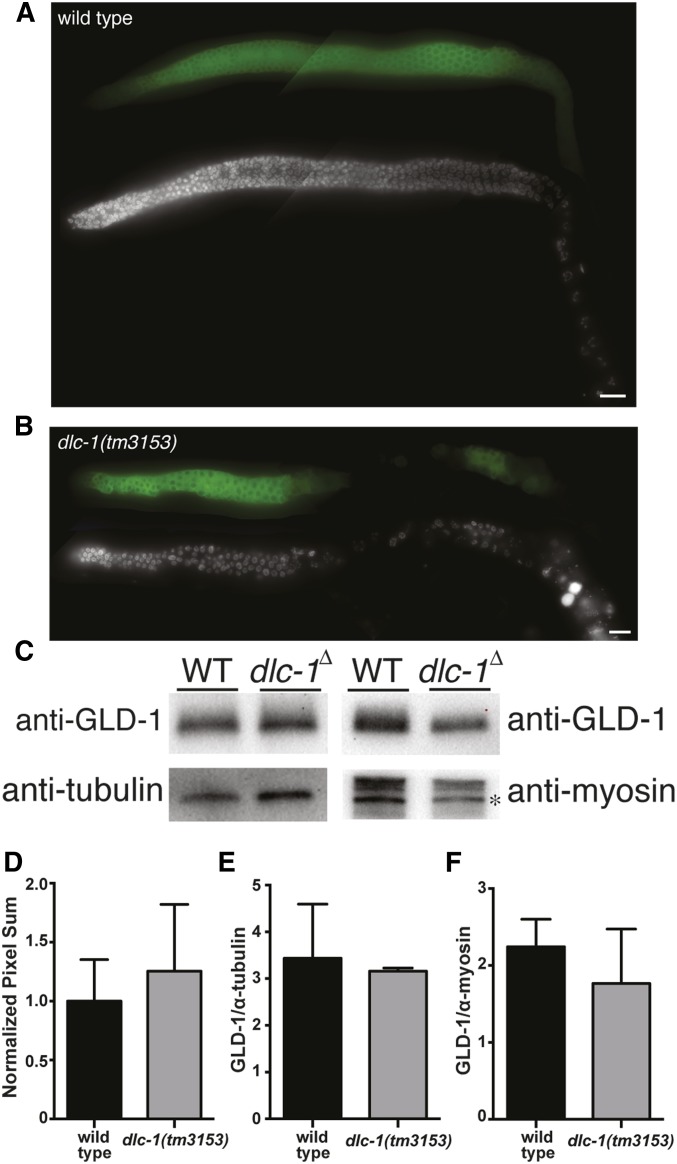
GLD-1 protein expression pattern and abundance is similar in wild-type vs. dlc-1(-) worms. Fluorescence micrographs of (A) wild-type and (B) dlc-1(tm3153) dissected gonads immunostained for GLD-1 protein using anti-GLD-1 antibody (Jones et al. 1996). Bar, 10 μm. (C) Western blot analysis of GLD-1 protein levels in the lysate of 50 wild-type or dlc-1(tm3153) whole worms probed with anti-GLD-1, anti-tubulin, and anti-MYO-3 antibodies. * indicates 210 kDa myosin heavy chain band. (D) Quantitation of GLD-1 protein expression in meiotic pachytene germ cells using LAS-X software (Leica). Wild type, N = 14; dlc-1(tm3153), N = 13; P > 0.17. Quantitation of GLD-1 protein level normalized to (E) tubulin and (F) myosin. Error bars represent SD from the mean. No significant differences in GLD-1 protein levels were observed in dlc-1(-) vs. wild-type control (GLD-1/anti-tubulin: P > 0.7, N = 3 of each genotype; GLD-1/anti-myosin: P > 0.4, N = 3 of each genotype). Student’s unpaired t-test was used to calculate P values.

