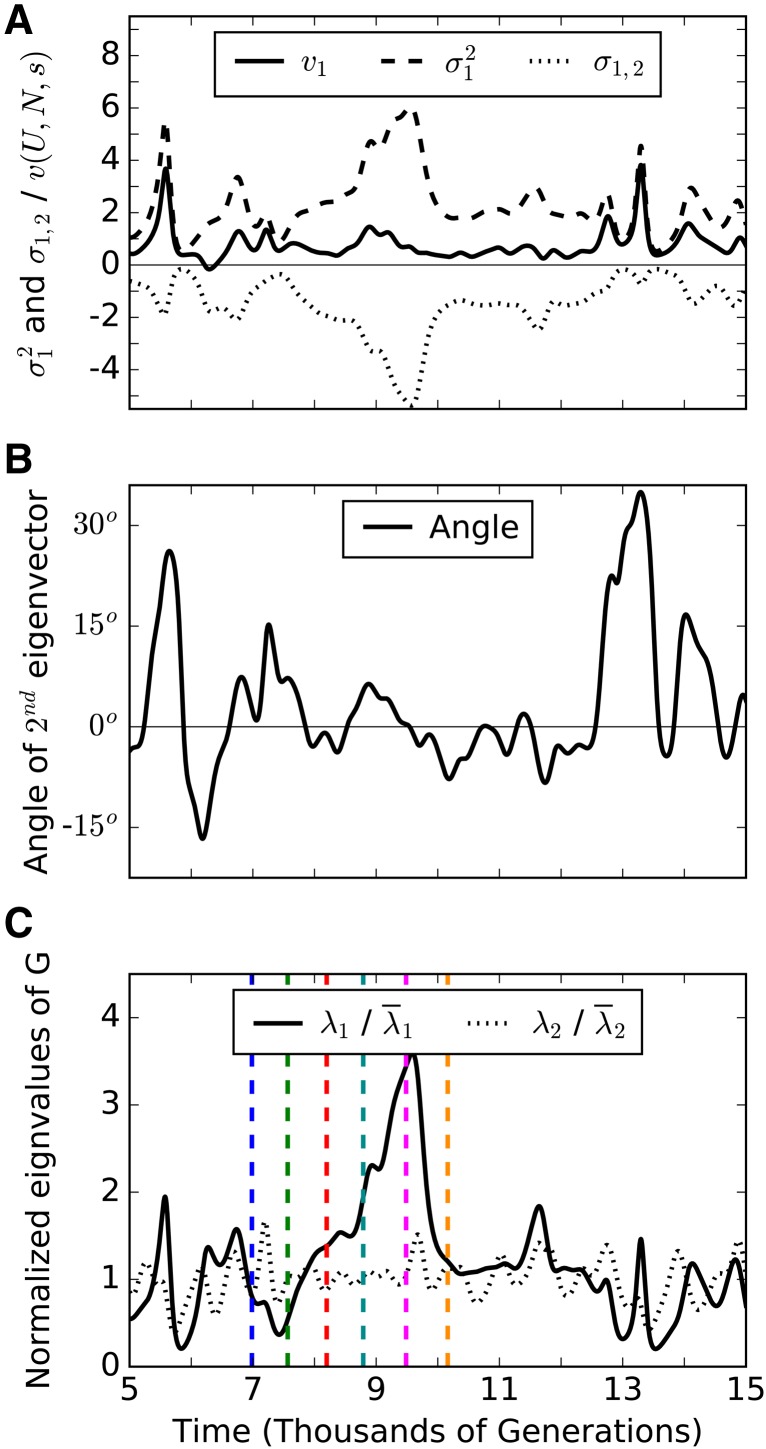
Figure 5.
Behavior of G over time. (A) Variance of trait one ( dashed line), its covariance with trait two (σ1,2, dotted line), and its contribution to adaptation ( solid line). Variances of (1.307) and σ1,2 (1.02) are around four times larger than the variance of (0.27) [units of ]. (B) The magnitude of the angle between the second eigenvector of G and direction of selection [vector (1,1)] is on average 7.2° for the time period shown. Its grand mean is 0 and deviations from this mean orientation are usually small. (C) Normalized eigenvalues of G, and measure genetic variation along the direction of selection and the perpendicular “neutral direction,” respectively. Normalization disguises the fact that as a result, it is fluctuations in that drive those in variances, covariance, and angle. Fluctuations in have a different cause and are uncorrelated. Spikes in are due to enlargement of the high-fitness front, followed by its collapse (colored lines mark time points at which the 2D distribution is shown in Figure 7). Simulation parameters: s = 0.02, U = 10−5, and N = 109.

