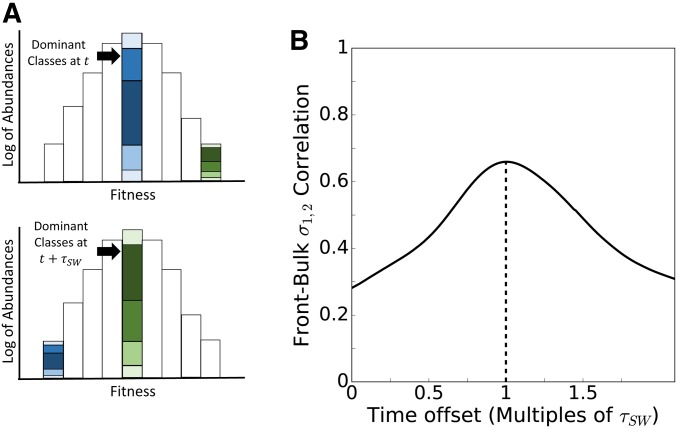
Figure 6.
The G matrix is dominated by the highest abundance classes, whose composition reflects the previous distribution of classes along the high-fitness front. (A) Each fitness class combines all genotypes along the same fitness isocline (diagonal in Figure 2). The two-dimensional traveling wave in two-dimensional trait space can thus be projected onto a one-dimensional traveling wave in fitness space. Shading indicates the distinct genotypes defined in two-dimensional trait space. Selection makes the most abundant fitness class exponentially larger than other fitness classes, meaning that the distribution of distinct genotypes within a single fitness class dominates the variances and covariances of the population as a whole. As the peak shifts from one fitness class to the next, variances and covariances may change substantially. (B) The correlation over time between covariance within the high-fitness front and covariance within the peak classes is highest with a time offset equal to the mean sweep time given in Equation 4 (the average time required for the front to become the peak; dashed line). This is because the distribution of genotypes within a fitness class was set during the stochastic phase, and simply propagated deterministically until this fitness class became the most abundant. The dynamics of the stochastic front explain 66% of fluctuations in the covariance detected in the bulk after generations.

