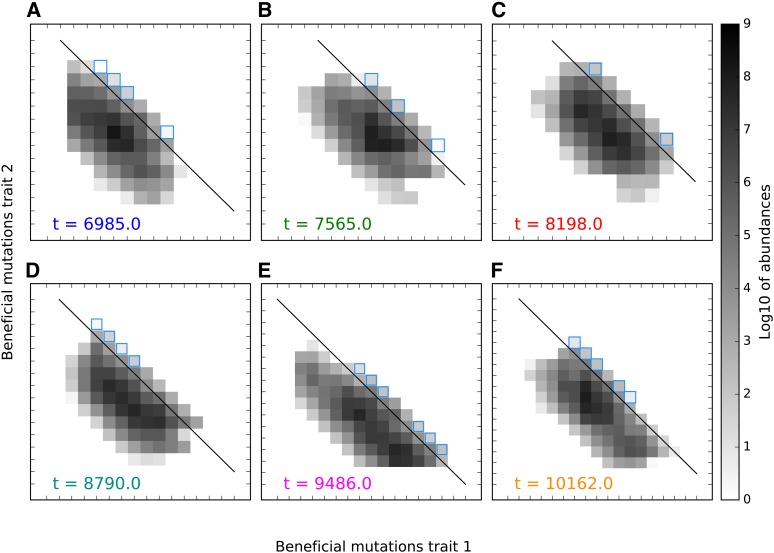
Figure 7.
Expansion and collapse of the high-fitness front depicted with snapshots (A–F) of the two-dimensional distribution, corresponding by color to vertical lines in Figure 5C. Snapshots are approximately apart ( generations), in each case one generation before the first still higher fitness genotype appears by mutation. Squares with blue outlines are in the stochastic growth phase, and are fed mutations from classes along the fitness isocline indicated by the black line. (A) A narrow high-fitness front following a recent minor collapse, concentrated in two adjacent squares without outlines. (B) Even as genetic variation in the bulk declines, it increases within the narrow high-fitness front, breaking apart into two dominant segments. (C) The segments stochastically converge again, allowing for later widening of the front. (D) The width of the high-fitness front reaches a maximum, although maximum covariance will occur only generations later. The lower right portion of the front is moving ahead of the top left section, setting it up for later collapse. (E) is at a local maximum, and the front is collapsing. The portion of the bulk no longer connected to the high-fitness front declines. (F) The high-fitness front collapses further as one segment continues to dominate its advances. Genetic variance in the neutral direction drops and causes negative covariance to decrease. Simulation parameters: s = 0.01, U = 10−5, and N = 109.

