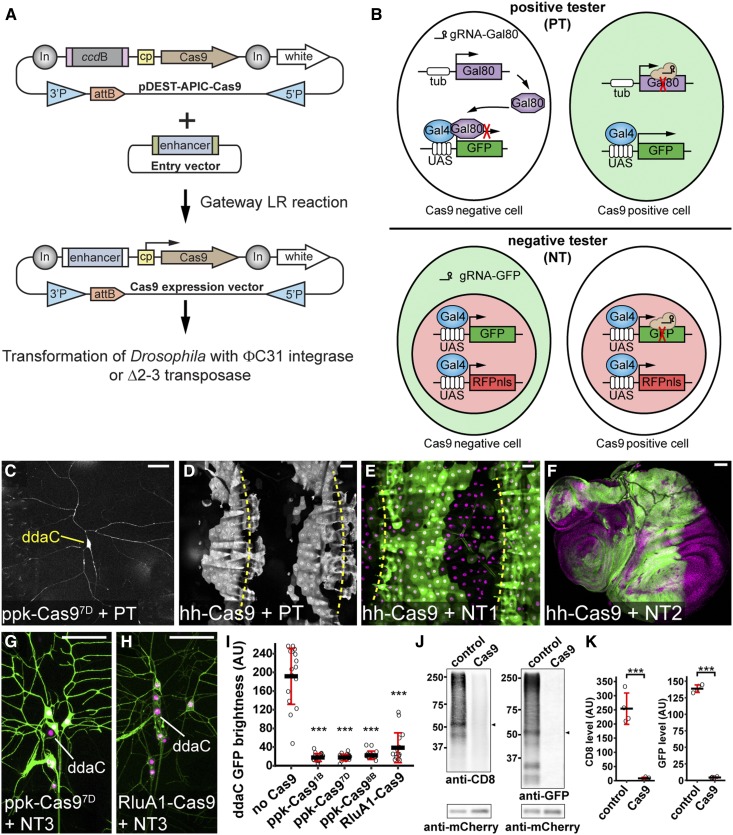
Figure 1.
Generation and evaluation of tissue-specific Cas9 lines, (A) Diagram of Gateway cloning and transgenesis of Cas9 expression vectors. In, Gypsy insulator; cp, core promoter; 3′P and 5′P, P-element sequences. (B) Diagrams of positive tester (PT) and negative tester (NT), illustrating how Cas9-expressing cells are visualized by each type of tester. In PT, two ubiquitous guide RNAs (gRNAs) target Gal80. In NT, two ubiquitous gRNAs target GFP. Full genotypes of Cas9 testers are in Table S1. (C and D) Patterns of Cas9 activity in ppk-Cas97D (C) and hh-Cas9 (D) as visualized by PT. (E and F) Patterns of hh-Cas9 activity in the larval epidermis as visualized by NT1 (E), and in wing, haltere, and leg imaginal discs as visualized by NT2 (F). The positions of body wall segmental borders (muscle attachment sites) are indicated by yellow broken lines in (D and E). ppk-Cas9 is predicted to be active in C4da neurons, including ddaC. hh-Cas9 is predicted to be active in the posterior compartments of epidermal segments and imaginal discs. (G and H) Patterns of Cas9 activity in ppk-Cas97D (G) and RluA1-Cas9 (H) as visualized by NT3. The cell bodies of ddaC neurons are indicated. (I) Quantification of ddaC GFP brightness in NT3 crosses using control (no Cas9) and various da neuron-specific Cas9 lines. *** P ≤ 0.001; one-way ANOVA and Dunnett’s test. n = 16 neurons for each genotype. Black bar, mean; red bars, SD. Bar, 50 μm. AU, arbitrary units. (J) Western blot of CD8 and GFP in larval homogenates of NT2 crossed to w1118 (control) or Act-Cas9 (Cas9). mCherry serves as the loading control. The bands used for quantification are indicated by arrowheads. (K) Quantification of CD8 and GFP levels in control and Cas9 after normalization with mCherry levels. *** P ≤ 0.001; unpaired Student’s t-test. Black bar, mean; red bars, SD. n = 4 biological replicates.

