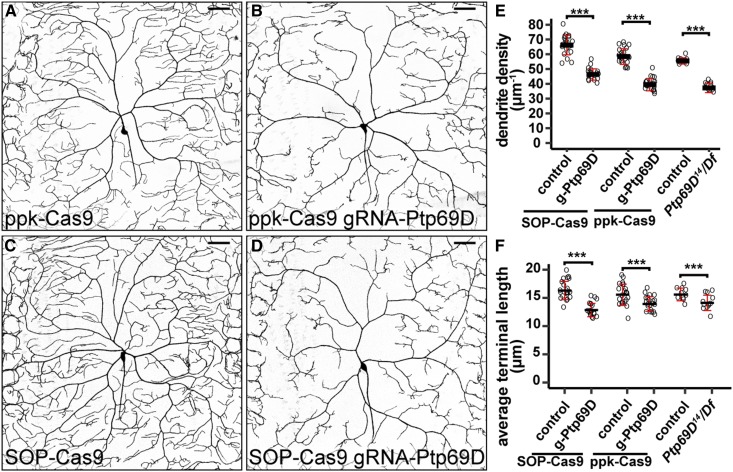
Figure 5.
Postmitotic knockout of Ptp69D is sufficient to reveal its function in C4da neurons. (A–D) DdaC neurons in ppk-Cas9 control (A), ppk-Cas9 gRNA-Ptp69D (B), SOP-Cas9 control (C), and SOP-Cas9 gRNA-Ptp69D (D). (E and F) Quantification of total dendrite density (E) and average terminal dendrite length (F) in the genotypes indicated. Each circle represents an individual neuron: ppk-Cas9 (n = 22); ppk-Cas9 gRNA-Ptp69D (n = 21); SOP-Cas9 (n = 22); and SOP-Cas9 gRNA-Ptp69D (n = 20). Data for Ptp69D14/Df(3L)8ex34 (n = 12) and its control (n = 10) are cited from Poe et al. (2017) for comparison. *** P ≤ 0.001; unpaired Student’s t-test. Black bar, mean; red bars, SD. Bar, 50 μm.

