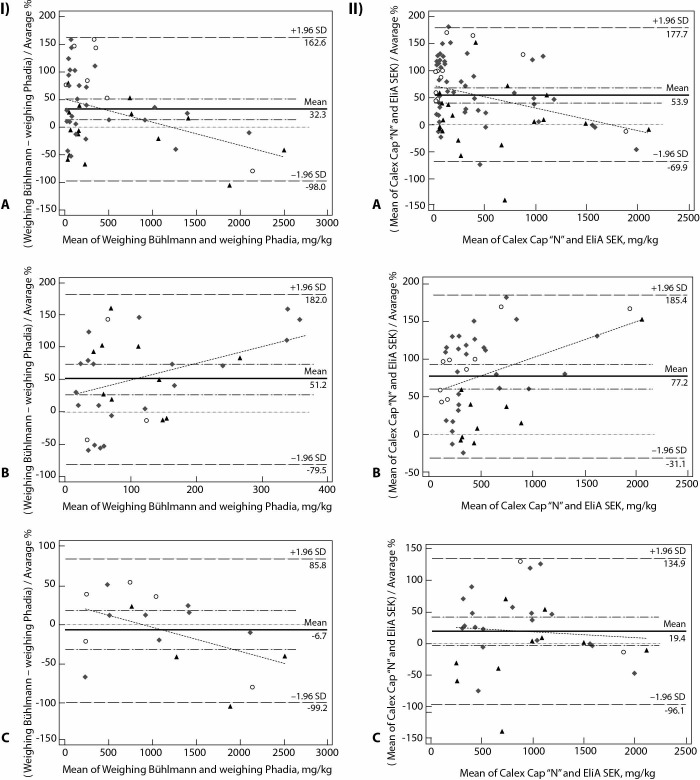
Figure 2.
Bland-Altman plot of faecal calprotectin (FC) values between EliA™Calprotectin and Bühlmann fCAL® Turbo with regard to extraction method used. I) Comparison of weighing methods: A) comparison of all FC results (N = 52); B) comparison of FC results < 200 mg/kg (N = 35); C) comparison of FC results > 200 mg/kg (N = 17). II) Comparison of volume-based extraction devices EliA Stool Extraction Kit (EliA SEK) vs 6-groove Bühlmann Calex® Cap “N”: A) comparison of all FC results (N = 77); B) comparison of FC results < 200 mg/kg (N = 46); C) comparison of FC results > 200 mg/kg (N = 31). The difference in Bühlmann fCAL Turbo and EliATM Calprotectin FC concentration is plotted against the mean FC concentration of both methods. Different shapes of markers represent different stool consistency category: circle - hard (BSS 1, 2); diamonds - normal (BSS 3, 4, 5); triangle - liquid (BSS 6, 7). BSS – Bristol stool scale.

