
Fig 1.
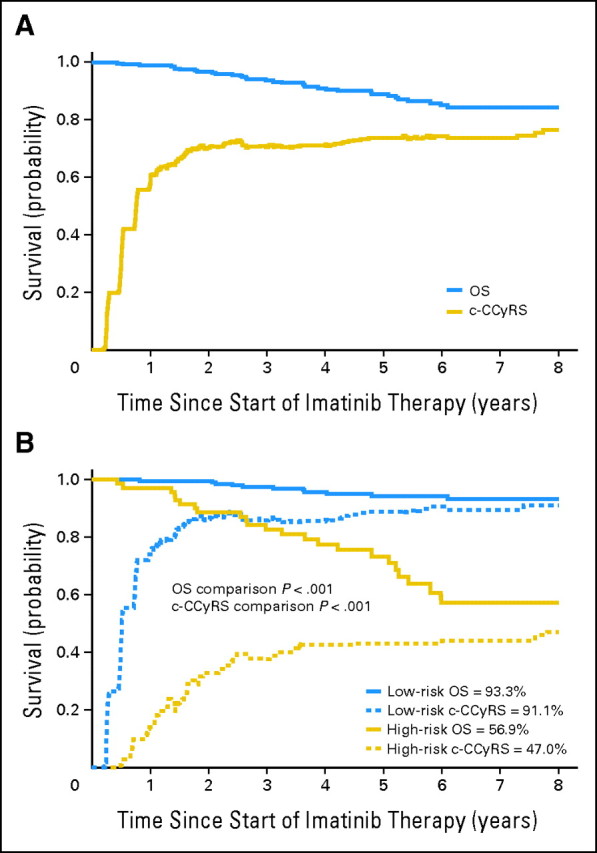
Eight-year probability of overall survival (OS) and current complete cytogenetic response survival (c-CCyRS) in the whole population and with patients stratified by risk group defined by BCR-ABL1 transcript level at 3 months. (A) The probability of 8-year survival in the whole population was 84.3%. During follow-up, 34 patients died, 12 of causes unrelated to leukemia. When only the leukemia-related deaths were taken into account, the 8-year probability of OS was 89.2%. The 8-year probability of c-CCyRS was 76.6%, which represents the probability of being alive and in remission (complete cytogenetic response [CCyR]) at a given time point; thus, the curve fluctuates as patients gain or lose CCyR (or die). It is interesting to observe that after the third year, the c-CCyRS curve remains practically unchanged. (B) Eight-year probability of OS and c-CCyRS for patients according to the risk group defined by transcript levels at 3 months (high-risk BCR-ABL1/ABL1 ratio > 9.84% [n = 68]; low-risk BCR-ABL1/ABL1 ≤ 9.84% [n = 211]). The high-risk group (red lines) had a significantly lower OS (56.9% v 93.3%; P < .001) and c-CCyRS (47.0% v 91.1%; P < .001) than the low-risk group (blue). The 6- and 12-month landmark analyses show similar results: OS was 74.7% versus 93.7% (P < .001) and 74.7% versus 95.4% (P < .001) and c-CCyRS was 53.1% versus 91.7% (P < .001) and 53.3% versus 91.3% (P = .001), respectively.