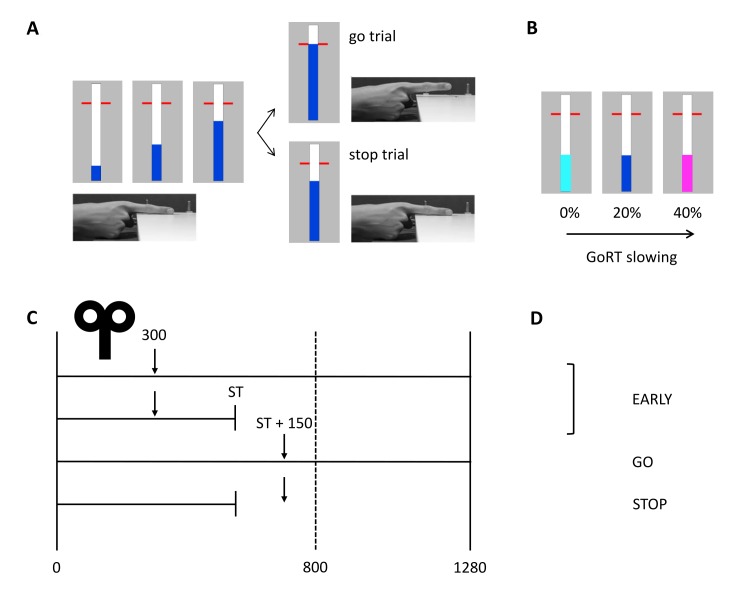
Figure 5.
Anticipated response version of the stop-signal paradigm with timing of TMS and conditions of interest. (A) In go trials, participants had to stop the bar as close as possible to the horizontal target at 800 ms from trial onset. The bar could be stopped by releasing the right index finger from the switch. In stop trials, the bar stopped automatically and participants had to cancel the movement of lifting their finger. (B) Proactive inhibition was assessed by manipulating the stop-signal probability. The color of the bar indicated the probability of stops (light blue: 0%, blue: 20%, magenta: 40%). (C) The solid vertical lines represent the start (0 ms) and finish time (1280 ms) of the trial. The target is indicated by the vertical dashed line at 800 ms from trial onset. The TMS test stimulus was delivered at 300 ms from trial onset (early) or 150 ms after the participant-specific stop time (late) in go and stop trials. The stop time was determined for each participant separately and was based on task performance without TMS. (D) Three different conditions were included in the statistical analyses: early, stop and go. GoRT: go response time, ST: stop time.

