
Figure 1.
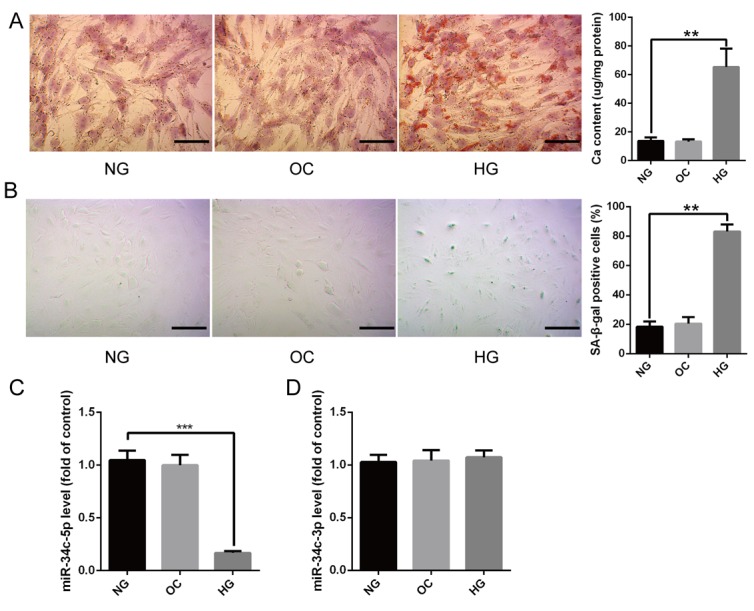
The expression of miR-34c-5p in HG-induced HA-VSMCs. (A) HA-VSMCs were treated with NG, OC, or HG for 14 days and then subjected to Alizarin Red S staining. The calcium content was extracted with cetylpyridinium chloride and quantified by spectrophotometry. Representative pictures are shown and the scale bar is 100 μm. (B) HA-VSMCs were treated with NG, OC, or HG for 72 hours and then subjected to SA-β-gal staining. Semi-quantitative analysis of SA-β-gal positive cells were performed using Image J. (C and D) qRT-PCR showing the expression of miR-3c-5p and miR-34c-3p in the above three groups. The data are expressed as mean ± SD, n=3, **p<0.005, ***p<0.0005. NG: normal glucose; OC: osmolarity control; HG: high glucose.