
Figure 1. Regulatory T cells (Tregs) express significantly higher TACI than conventional T cells (Tcons) freshly isolated from the same patient.
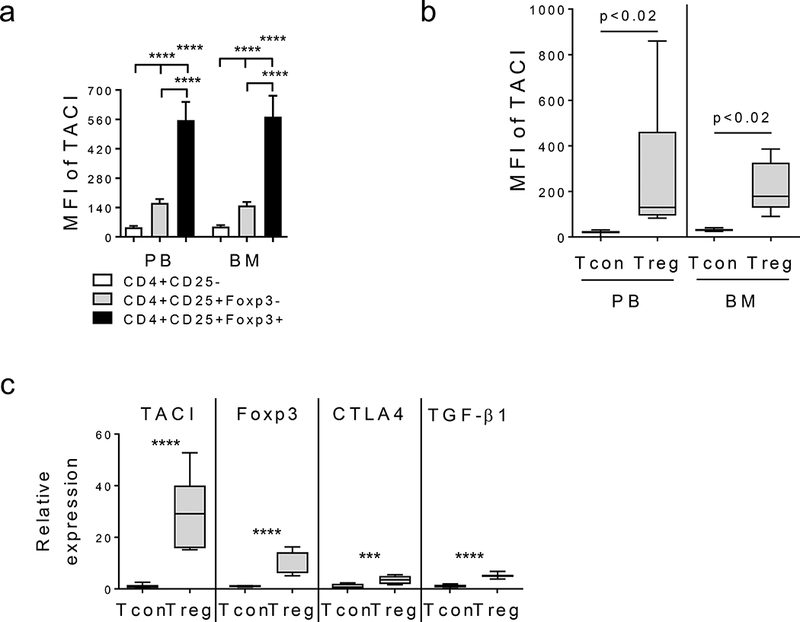
(a) Using flow cytometry analysis, median fluorescence intensity (MFI) of TACI was determined in indicated subsets of CD4+ T cells of PB and BM compartments from MM patients (n=47). TACI protein levels are highest on regulatory T subset (Treg, CD4+CD25+Foxp3+, black) followed by CD4+CD25+Foxp3-subset (gray). TACI MFIs in conventional T cells (Tcon, CD4+CD25-, white) are as similar as isotype control Ab. (b) TACI MFIs are shown for Treg vs paired Tcon from additional 9 MM patients. (c) Tregs were separated from Tcons from 9 MM patients followed by RNA extraction to quantitate TACI transcripts by qRT-PCR. Foxp3, CTLA4, and TGFβ serve as control genes to identify Tregs. Expression levels were normalized by internal control GAPDH then shown are relative expression levels in Tregs vs Tcons* p < 0.05, ** p < 0.01, *** p < 0.001, **** p < 0.0001.