
Figure 2.
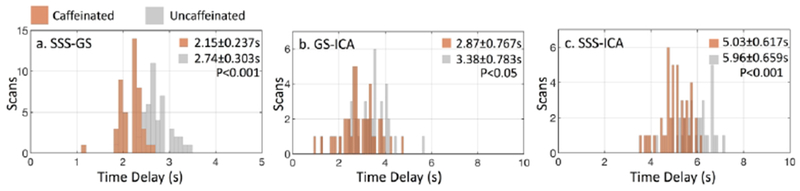
Comparison of time delay distribution between 45 caffeinated RS scans (brown) and 45 uncaffeinated RS scans (gray). Time delays were calculated between (a) SSS and GS, (b) GS and ICA and (c) SSS and ICA. Results with absolute maximum cross-correlation coefficient less than 0.28 were excluded to avoid spurious correlations. Time delay distributions between caffeinated and uncaffeinated scans were compared by Kolmogorov-Smirnov test.