
Figure 7.
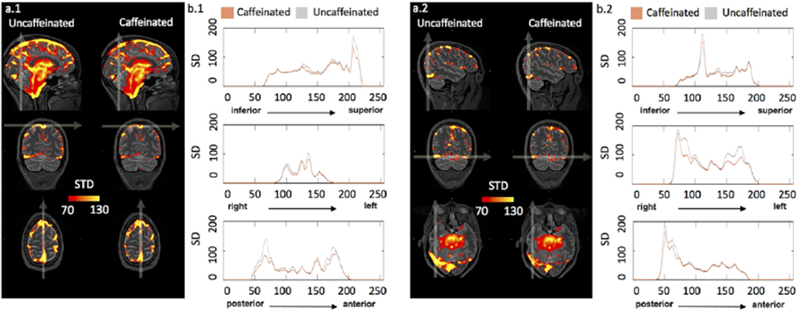
(a1-2) show the average SD maps of caffeinated and uncaffeinated scans at different MNI coordinates. (b1-2) were SD intensity profiles, which reflected the corresponding SD values along the white arrow in both averaged uncaffeinated (gray) and caffeinated scans (brown) from (a1-2),respectively.