
Figure 4:
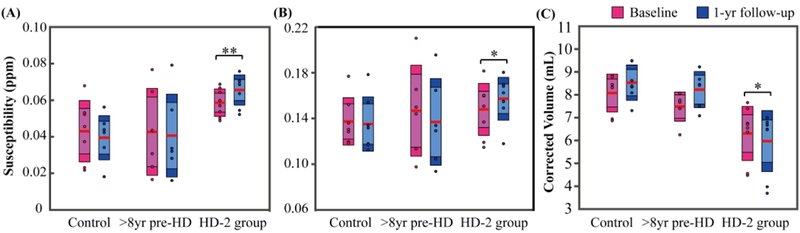
Longitudinal changes of magnetic susceptibility in caudate nuclei (A) and globus pallidus (B) and changes of corrected volumes in caudate nuclei (C) in the one-year follow-up exam. The boxes shaded with lighter colors denote the 95% CI and the darker colors denote ±1 SD. The red lines represent the mean. * and ** indicate significant difference over one-year with p < 0.05 and p < 0.01. HD-2 group contains the <8yr pre-HD and early HD patients.