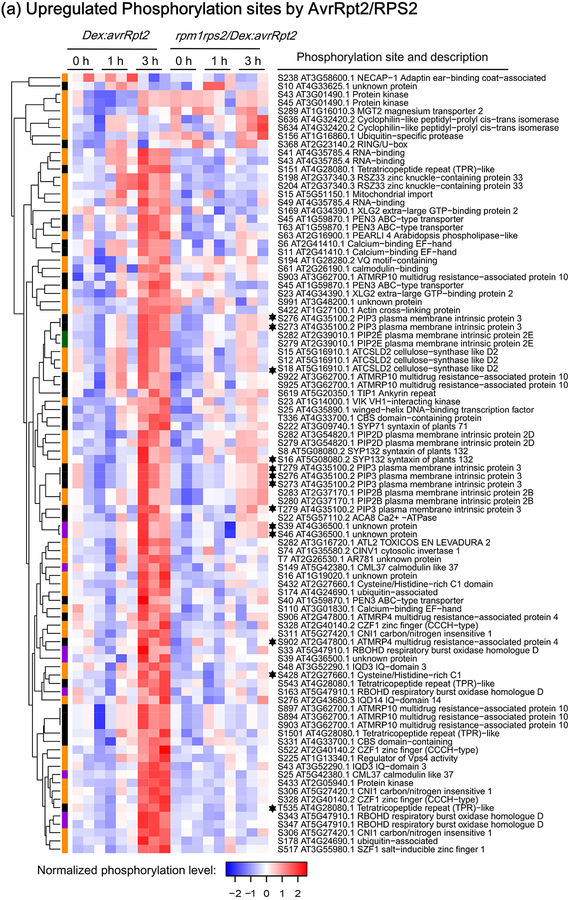
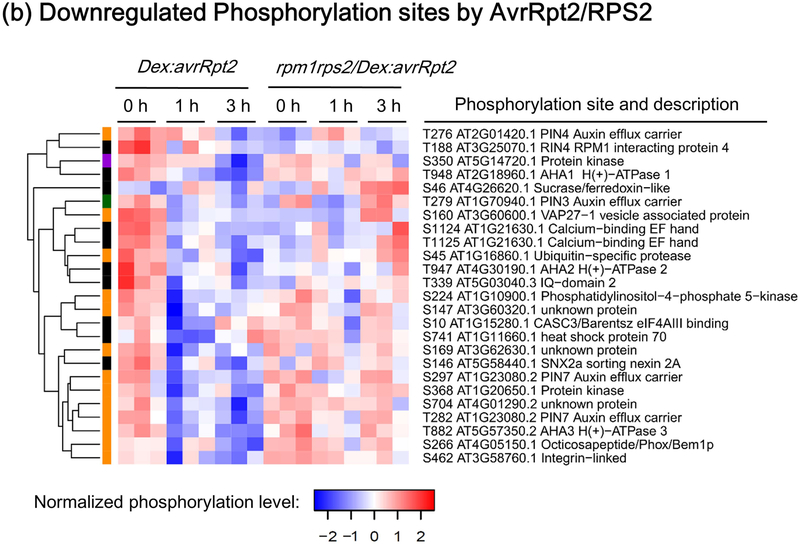
Figure 2.
Heat-maps showing RESISTANT TO P. SYRINGAE-2 (RPS2)-regulated phosphorylation sites. The phosphorylation sites shown are differentially phosphorylated upon RPS2 activation (one-way ANOVA p≤0.05 + t-test p≤0.05). (a) Phosphorylation sites significantly upregulated by RPS2 in Dex:avrRpt2 plants. (b) Phosphorylation sites significantly downregulated by RPS2 in Dex:avrRpt2 plants. Dendrograms were obtained by hierarchical clustering to represent Euclidian distances of normalized expression profiles. The colored sidebar indicates the regulation at the protein level in total protein membrane fractions (Supporting Information Table S1): black, sites for which the protein levels were not significantly altered amongst treatments; magenta, sites for which protein levels were significantly increased in Dex:avrRpt2 plants upon application of dexamethasone (Dex); green, sites for which protein levels were significantly decreased in rpm1rps2/Dex:avrRpt2 plants upon Dex application; orange, sites for which no peptides were detected in total protein samples; black stars, the phosphorylation sites upregulated in both lines after Dex treatment.


