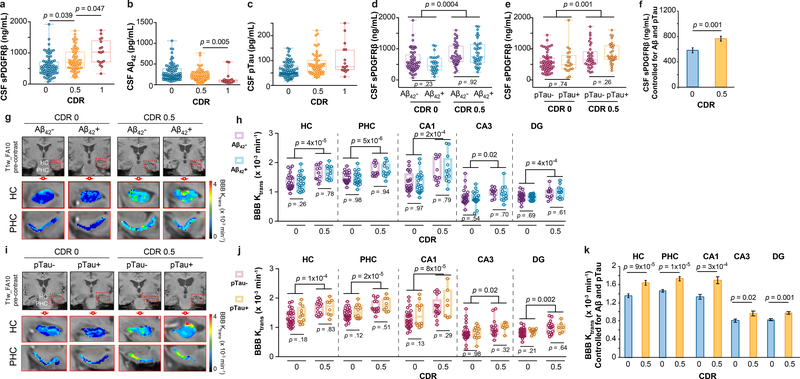
Figure 1. Early brain capillary damage and blood-brain barrier breakdown in human hippocampus and parahippocampal gyrus in individuals with increased clinical dementia rating score is independent of amyloid-β and tau status.
(a-c) CSF soluble platelet-derived growth factor receptor-β (sPDGFRβ) (a), Aβ1–42 (b) and pTau (c) levels in individuals with clinical dementia rating (CDR) score 0 (n=82), 0.5 (n=65) and 1 (n=17). (d) CSF sPDGFRβ in individuals with no cognitive impairment (CDR 0) that are CSF Aβ1–42 negative (Aβ-; n=53) or positive (Aβ+; n=29), and with cognitive dysfunction (CDR 0.5) that are Aβ- (n=38) or Aβ+ (n=38). (e) CSF sPDGFRβ in CDR 0 participants that are CSF pTau negative (pTau-; n=60) or positive (pTau+; n=21) and CDR 0.5 participants that are pTau- (n=33) or pTau+ (n=29). (f) CSF sPDGFRβ controlled for CSF Aβ42 and pTau levels in CDR 0 (n=80) and CDR 0.5 (n=61) participants. Estimated marginal means ± SEM from ANCOVA models. (g-h) Representative blood-brain barrier (BBB) Ktrans maps in the hippocampus (HC) and parahippocampal gyrus (PHC) (g), and quantification of Ktrans values in HC, PHC, and CA1, CA3 and dentate gyrus (DG) hippocampus subfields in CDR 0 individuals that are Aβ- (n=24) or Aβ+ (n=20) and CDR 0.5 participants that are Aβ- (n=11) or Aβ+ (n=12) (h). (i-j) Representative BBB Ktrans maps in HC and PHC (i), and quantification of Ktrans values in HC, PHC, and CA1, CA3 and DG hippocampus subfields in individuals with CDR 0 that are pTau- (n=32) or pTau+ (n=12), and with CDR 0.5 that are pTau- (n=14) or pTau+ (n=8) (j). (k) Regional Ktrans values controlled for CSF Aβ and pTau levels in CDR 0 (n=44) and CDR 0.5 (n=23) individuals. Estimated marginal means ± SEM from ANCOVA models. Box-and-whisker plot lines indicate median values, boxes indicate interquartile range and whiskers indicate minimum and maximum values. Significance tests after FDR correction from ANCOVAs with post-hoc Bonferroni comparisons.

