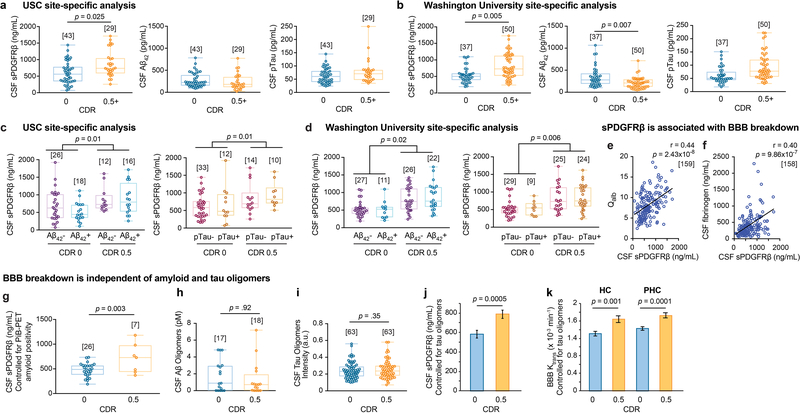
Extended Data Figure 2. CSF sPDGFRβ increases with CDR impairment, independent of Aβ and tau, and reflects blood-brain barrier (BBB) breakdown.
(a-b) Site-specific analysis of CSF sPDGFRβ and standard AD biomarkers, Aβ42 and pTau, indicates an early increase in sPDGFRβ with increasing CDR in both independent clinical sites, USC (a) and Washington University (b). There were no changes in Aβ42 and pTau at USC site (a), whereas Aβ42, but not pTau, was altered at Washington University site; supports Figure 1 a-c. (c-d) Site-specific analysis of CSF sPDGFRβ increases with CDR, independent of CSF Aβ42 and pTau status in two independent sites, USC (c) and Washington University (d); supports Figure 1 d-f. (e-f) CSF sPDGFRβ is associated with blood-brain barrier (BBB) breakdown. CSF sPDGFRβ positively correlates with conventional biochemical biomarkers of BBB breakdown including CSF:plasma albumin ratio (Qalb) (e) and CSF fibrinogen (f); supports Figures 1 and 3. (g) CSF sPDGFRβ is increased with CDR, independent of amyloid positivity by (11)C-Pittsburgh compound B positron emission tomography (PiB-PET); supports Figure 1 d and f. (h-i) No differences were observed in CSF Aβ oligomer levels (h) and tau oligomer levels (i) in individuals with CDR 0 vs. CDR 0.5; supports Figure 1 d-f. (j-k) Increases in CSF sPDGFRβ (j) and regional BBB Ktrans in the hippocampus (HC) and parahippocampal gyrus (PHC) (k) of individuals with CDR 0.5 vs. CDR 0 remain significant after statistically controlling for the impact of CSF tau oligomers; supports Figure 1 d-f. Panels a-d, g-i: Box-and-whisker plot lines indicate median values, boxes indicate interquartile range and whiskers indicate minimum and maximum values. Panels a-d, g: significance tests from ANCOVAs. Panels e-f: Statistical significance determined by Pearson correlation; r = Pearson correlation coefficient. Panels h-i: Significance by two-tailed Student’s t-test at α=0.05. Panels j-k: ANCOVA models representing estimated marginal means ± SEM. Brackets denote sample size (n) in each analysis.

