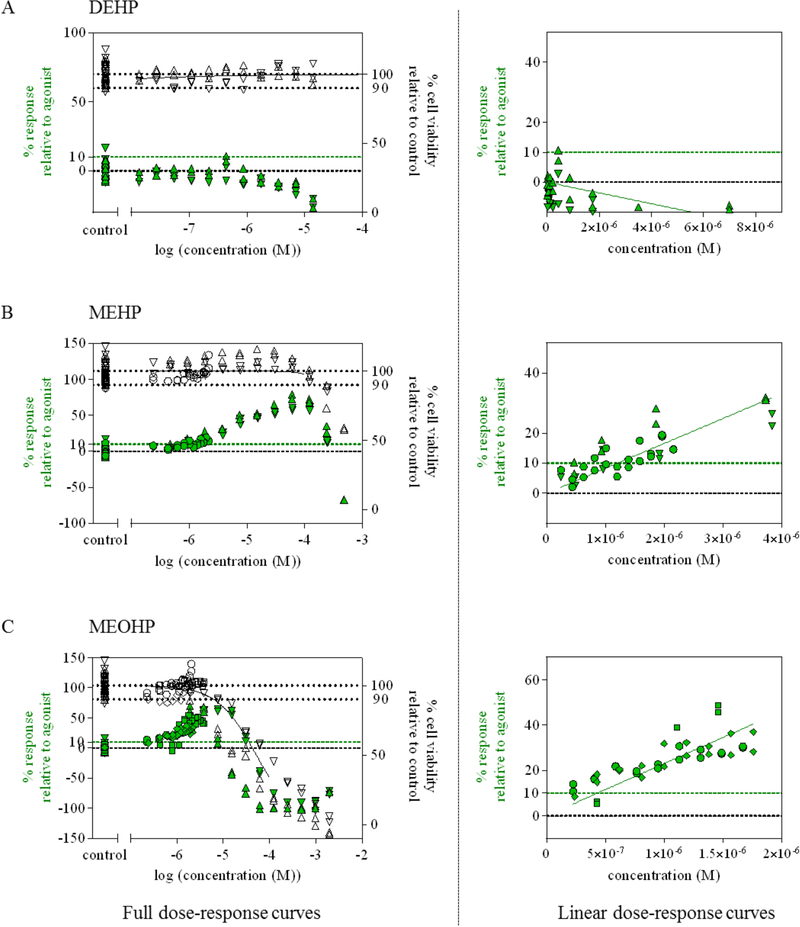
Figure 7: Dose response curves for DEHP and its metabolites MEHP and MEOHP.
Presented are the observed cytotoxicity (white symbols, right y-axis) and activation of PPARγ (green symbols, left y-axis) relative to the agonist rosiglitazone for DEHP (A), MEHP (B) and MEOHP (C). The activation of PPARγ is shown as full dose-response curve (left) and as linear dose-response curve (right). The EC10 of each compound was derived from the linear dose response curve. Different symbols represent three independent experiments.

