
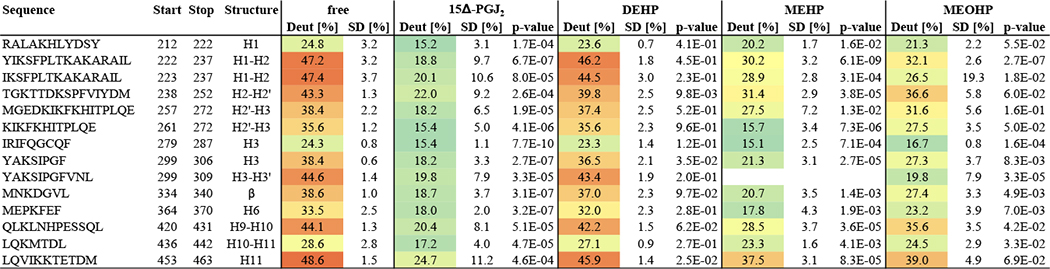
Table 1: Percentage deuteration of significantly protected peptides after 1 min deuteration.
The percentage deuteration values of peptides that were significantly protected (p-value < 0.001) for at least one of the compounds are shown as well as the corresponding standard deviations and p-values obtained by performing a t-test against the free PPARγ. The cells are colored based on the percentage deuteration values. The peptides in this table are visualized in Figure 3C using the example of 15Δ-PGJ2 and were used for the cluster analysis presented in Figure 5.
 |