
Figure 6.
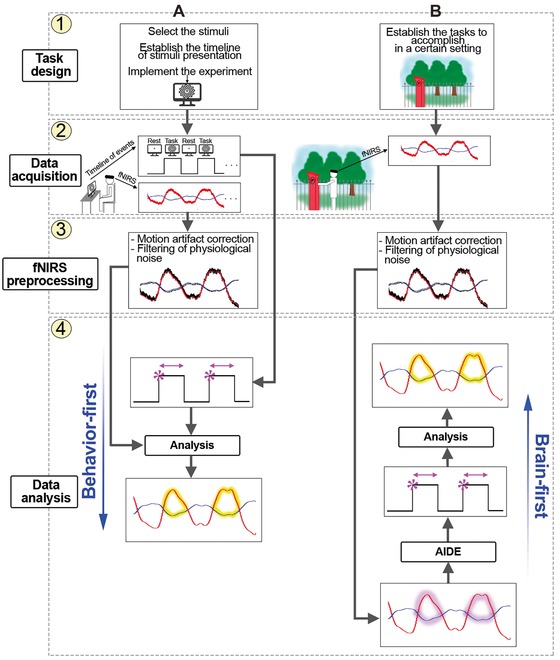
Example of neuroimaging experiment pipelines with fNIRS in case of typical computer‐based (A) and ecological (B) experiments. In the first case, the timeline of the stimuli is predetermined (A1) and fNIRS data are recorded synchronously to that (A2). Preprocessed fNIRS data (A3) are used to assess the presence of significant hemodynamic changes (yellow areas, A4) feeding conventional analysis methods (A4) with the events timeline (behavior‐first). In ecological experiments, tasks do not have a particular structure (B1) and fNIRS data are recorded continuously (B2). New methods such as AIDE (B4) are then able to recover the timeline of functional events from preprocessed fNIRS data (B3, brain‐first) by looking at particular patterns in HbO2 and HbR signals (magenta areas, B4). The recovered events can be used to assess the presence of functional activation (yellow areas, B4).