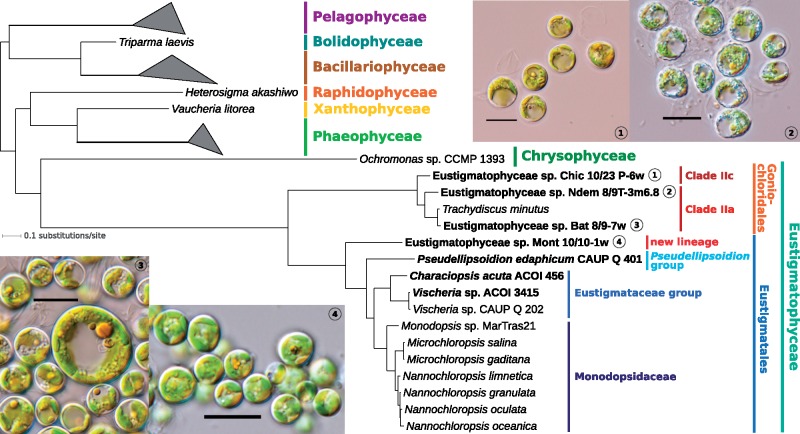
Fig. 1.
—Eustigmatophyte phylogeny inferred from pt genome data. The tree shown was inferred using PhyloBayes-MPI v1.7 and the site-heterogeneous substitution model CAT + GTR from an alignment of 18,378 amino acid positions (derived from 68 conserved pt genome-encoded proteins). All branches received maximal support (posterior probability of 1.0). For simplicity, only the ochrophyte subtree is shown (omitting thus the outgroup comprising cryptophytes and haptophytes) and classes (other than eustigmatophytes) with multiple representatives are collapsed as triangles. Species (strains) with pt genomes sequenced in this study are highlighted in bold. Supplementary figure S10, Supplementary Material online, shows a full version of the essentially identical ML tree inferred from the same supermatrix using IQ-TREE v1.6.5. GenBank accession numbers of pt genomes employed in the phylogenomic analysis are listed in supplementary table S2 and in the legend to supplementary figure S10, Supplementary Material online. Light microphotographs are provided for the four sequenced strains whose appearance has been previously documented in the literature; scale bar: 10 μm.

