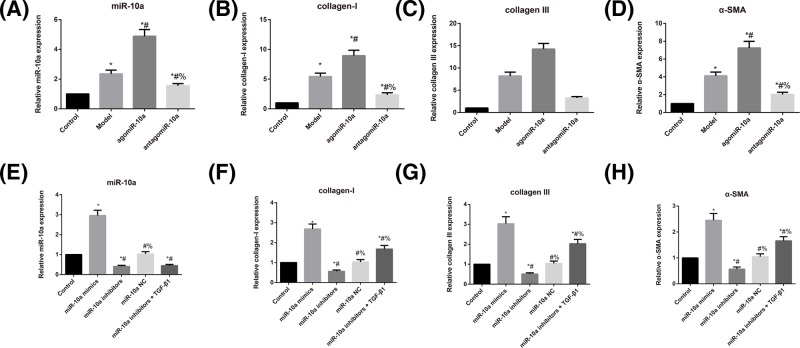
Figure 1. Comparison of expression levels of miR-10a fibrosis-related genes in rats and CFs.
(A–D) Expression levels of miR-10a (A), collagen-I (B), collagen III (C), and α-SMA (D) as determined by qRT-PCR in rats; *, P<0.05 compared with the Control group; #, P<0.05 compared with the Model group; %, P<0.05 compared with the agomiR-10a group. (E–H) Expression level of miR-10a (E), collagen-I (F), collagen III (G), and α-SMA (H) as determined by qRT-PCR in CFs; *, P<0.05 compared with the Control group; #, P<0.05 compared with the miR-10a mimics group; %, P<0.05 compared with the miR-10a inhibitors group.

