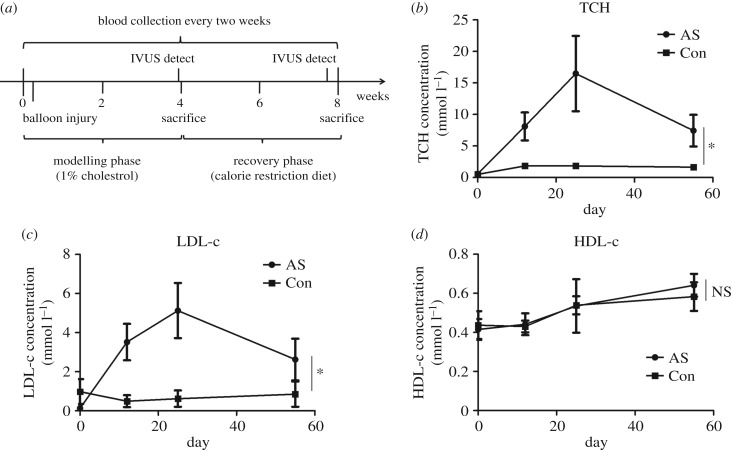
Figure 1.
Lipid profiles of rabbit atherosclerosis. (a) Experimental timeline. Rabbits were fed with a high-cholesterol diet (purified rabbit chow supplemented with 1% cholesterol) for four weeks. Three days into the diet, balloon injury of the abdominal aorta was performed. After four weeks of high cholesterol diet, rabbits switch to the calorie restriction diet for four more weeks (chow with no added cholesterol or fat, reduction of daily intake by 20% of ad libitum feeding). Blood was collected at 0, 2, 4 and 8 weeks for lipid measurement. Intravascular ultrasound imaging was performed at the end of the fourth and eighth weeks. (b–d) TCH, LDL-c and HDL-c concentrations during the progression and regression of atherosclerosis. Con, control (n = 4); AS, atherosclerosis (AS30, n = 8; AS60, n = 4). Data were reported as means ± s.d. and between-group comparisons were performed by Students' t-test. A p-value of less than 0.05 was considered significant.

