Figure 2.
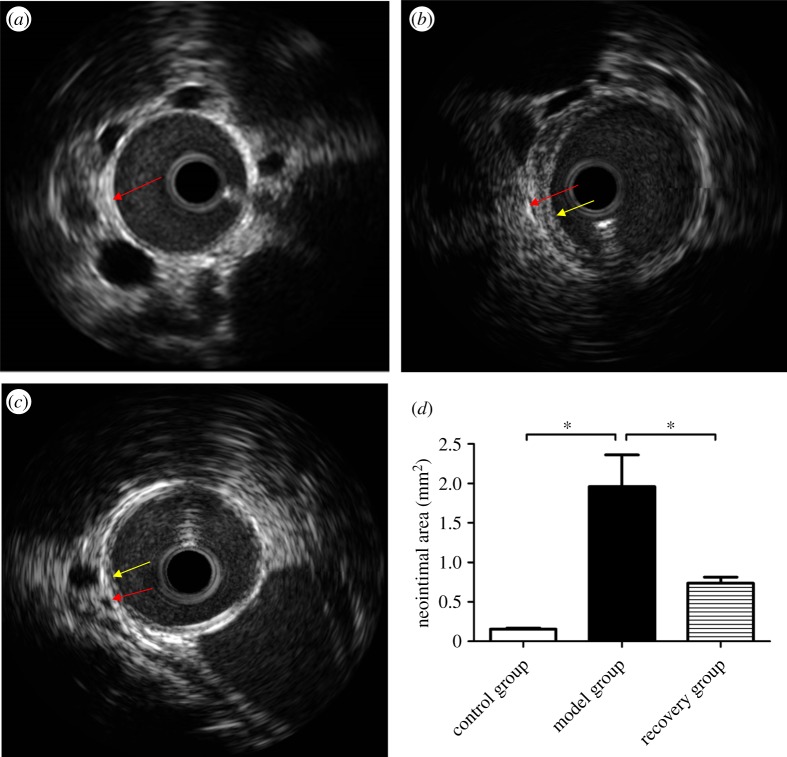
Intravascular ultrasound of rabbit atherosclerosis. Intravascular ultrasound images show representative pictures of rabbit abdominal aorta in control, model and recovery groups, respectively (a, b and c). Obvious neointima was observed in the model group and little neointima was observed in the recovery group, whereas no neointima was observed in the control group. The mean neointimal area was measured and analysed (d). The red and yellow arrows indicate the intima and the neointima, respectively. Data were reported as means ± s.d. and among three-group comparisons were performed by ANOVA, n = 4. *p < 0.05. A p-value of less than 0.05 was considered significant.

