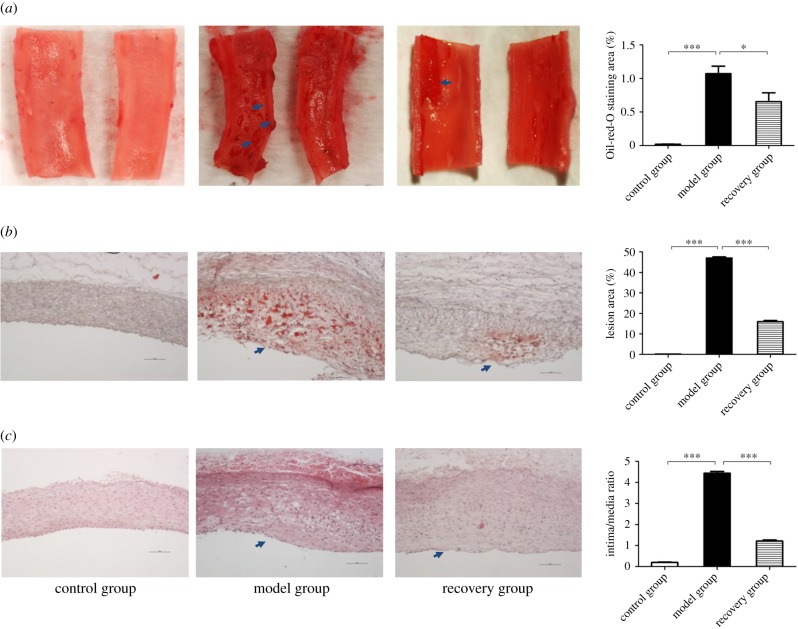
Figure 3.
The histology analysis of rabbit atherosclerosis. The whole abdominal aorta was stained using Oil red O solution for acquisition of the overall plaque formation (arrows). The percentage of lesion area was significantly increased in the model group and relatively decreased in the recovery group (a). The Oil red O staining of cryosections showed that there were obvious lipid droplets (arrow) in the vascular endothelial cells of the model group while significantly reduced in those of the recovery group (b). The HE staining of paraffin sections demonstrated the ratio of intima to media thickness among the three groups. The endothelial cells were significantly proliferated (arrow) in the model group and relatively decreased in the recovery group (c). The values of the percentage of lesion area and lipid droplet and the ratio of intima to media thickness were measured by ImageJ software, respectively (displayed on right side). Data were reported as means ± s.d. and among three-group comparisons were performed by ANOVA, n = 4. *p < 0.05, ***p < 0.001. A p-value of less than 0.05 was considered significant.

