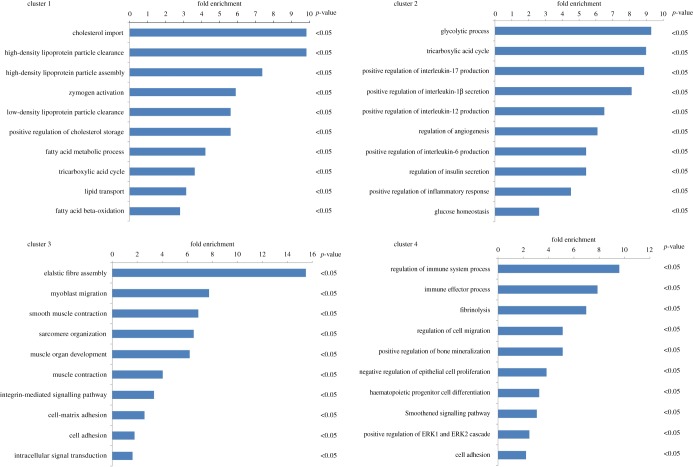
Figure 5.
The GO enrichment analysis of the four clusters. The genes of the four clusters were studied by GO enrichment analysis using the DAVID tool. There were 1476, 629, 989, and 622 differential expression genes in clusters 1, 2, 3 and 4, respectively. A p-value of less than 0.05 was considered significant.

