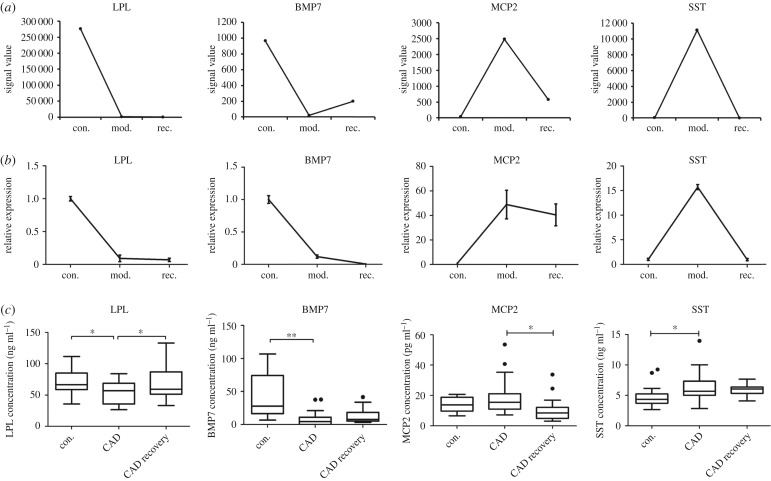
Figure 6.
Validation of the candidate biomarkers of human coronary artery disease. (a) Four candidate genes were shown by signal value. (b) Four differentially expressed genes were selected and their mRNA levels were measured using RT-PCR (n = 4) and (c) their protein concentrations in serum were measured using ELISA (con (n = 16), CAD (n = 28), CAD recovery (n = 20)). Data were reported as means + s.d. or median ± IQR and among three-group comparisons were performed by ANOVA. *p < 0.05, **p < 0.01. A p-value of less than 0.05 was considered significant.

