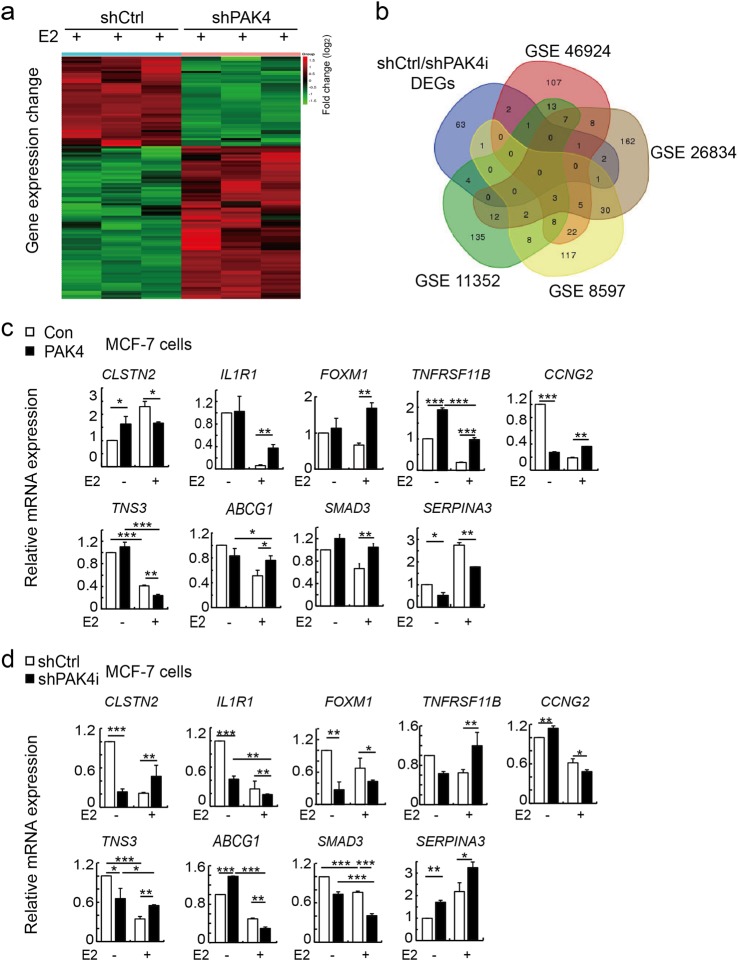
Figure 3.
PAK4 reverses ERα-mediated gene expression. a RNA-seq analysis profile of shPAK4 or shCtrl after treatment with E2 in MCF-7 cell. Heat map displays the altered expression of E2-induced genes upon PAK4 knockdown. Fold change is indicated at right. b Venn diagram showing four sets of microarray data from GEO databases (GSE46924, GSE26834, GSE8597, and GSE11352) and shCtrl/shPAK4 differentially expressed genes. c, d Real-time PCR (RT-PCR) analysis showing overexpression or knockdown of PAK4 reverses nine of ERα-mediated gene expression. MCF-7 cells stably overexpressing PAK4 (c) or stably knocking down PAK4 (d) were harvested after treatment with or without E2 (10−9 M) for 24 h. Total RNA was analyzed by Real-time quantitative PCR (RT-qPCR). Error bars represent mean ± s.d. *P < 0.05; **P < 0.01; ***P < 0.001

