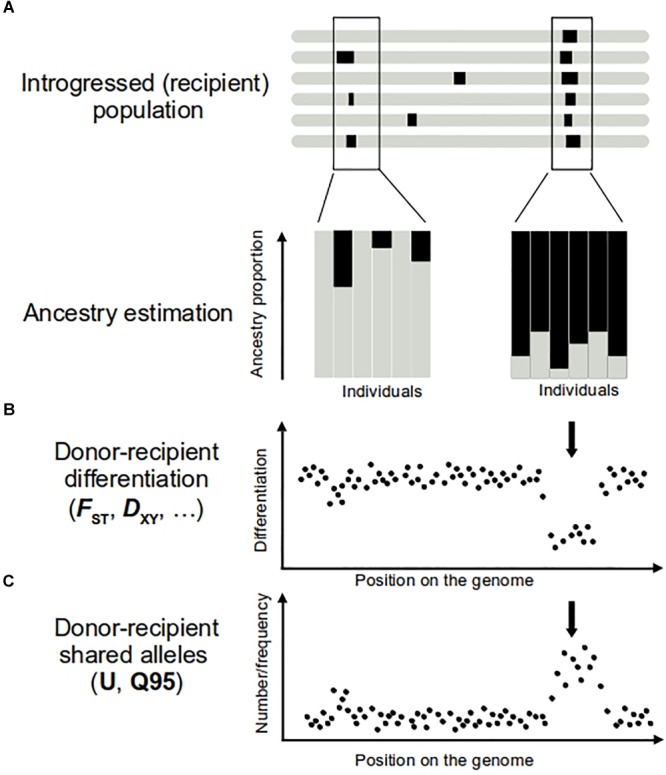
FIGURE 1.

Approaches to detect introgression (A,B) and adaptive introgression (C). On top representation of several genomes of the introgressed population, with introgression regions represented in black. Regions of donor origin in the recipient genome can be revealed by performing ancestry analyses (A) and comparisons of donor–recipient differentiation levels (B). Individuals bearing introgression show an ancestry origin in the donor population (A, in black). In the case of adaptive introgression, a large proportion of individuals of the recipient population show ancestry from donor population (A, right), while only few of them show a donor ancestry in the genome region carrying a neutral introgression (A, left). In the adaptive introgression, donor–recipient differentiation is lower (B, arrow) than the mean genome value. Positive selection increases the frequency of the donor allele and the neutral variants physically linked to it. The result is a higher number and frequency of alleles shared by donor and recipient populations (C, arrow) in this part of the genome. To calculate U and Q95 statistics, another condition should be met, that pattern described in (C) are absent in other non-introgressed populations.
