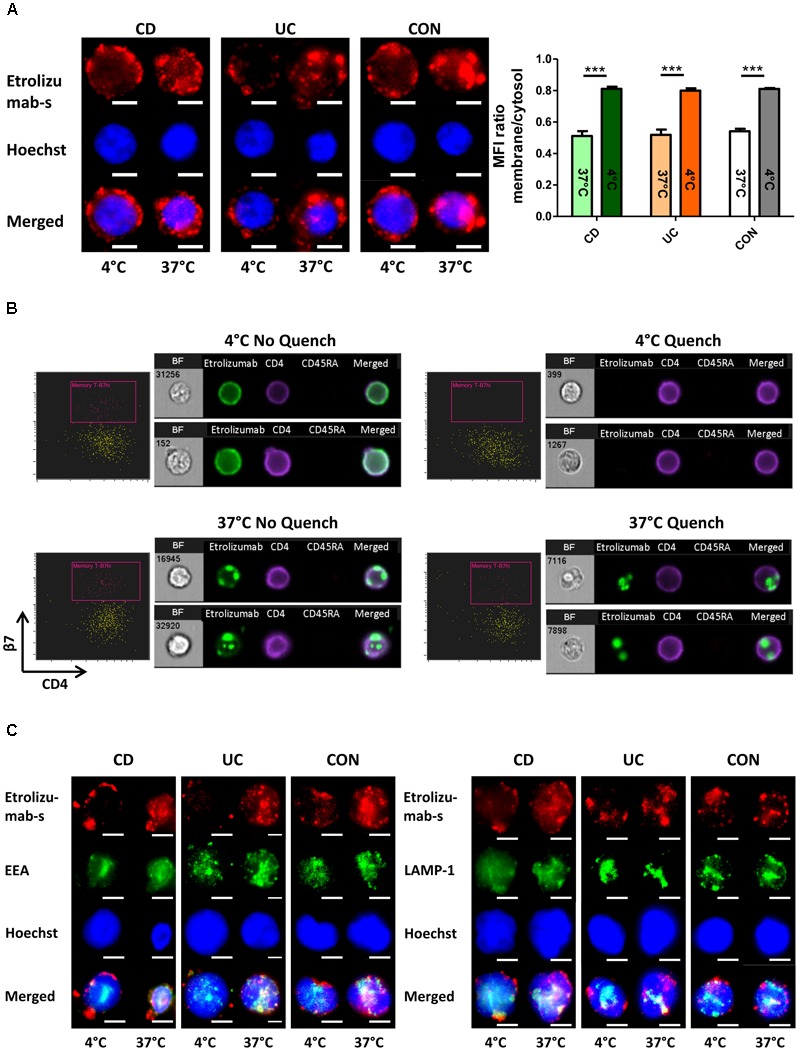
FIGURE 2.

β7 integrin is internalized by treatment of lymphocytes with etrolizumab(-s). (A) Left: Representative images showing localization of the fluorescence signal of AF647-labeled etrolizumab-s after treatment of cells from CD, UC, and CON donors at 4 or 37°C for 24 h. Scale bar: 3 μm. Right: Quantification of mean fluorescence intensity (MFI) of AF647 signal in the cytosol relative to the membrane at 4 and 37°C; n = 5 per group. ∗∗∗p < 0.001. (B) Assessment of etrolizumab internalization with ImageStream®. Representative flow cytometry and microscopy results after cell incubation with AF488-labeled etrolizumab at 4°C (upper row) or 37°C (lower row) and without (left panels) or with (right panels) quench procedure. BF, bright field. Data are representative for two independent experiments with a total of eight samples. (C) Representative images showing localization of AF647 fluorescence signal of etrolizumab-s and AF488 fluorescence signal of EEA (left) and LAMP-1 (right) after cell treatment with etrolizumab-s at 4 or 37°C for 24 h. Scale bar = 3 μm. Images are representative for three independent experiments.
