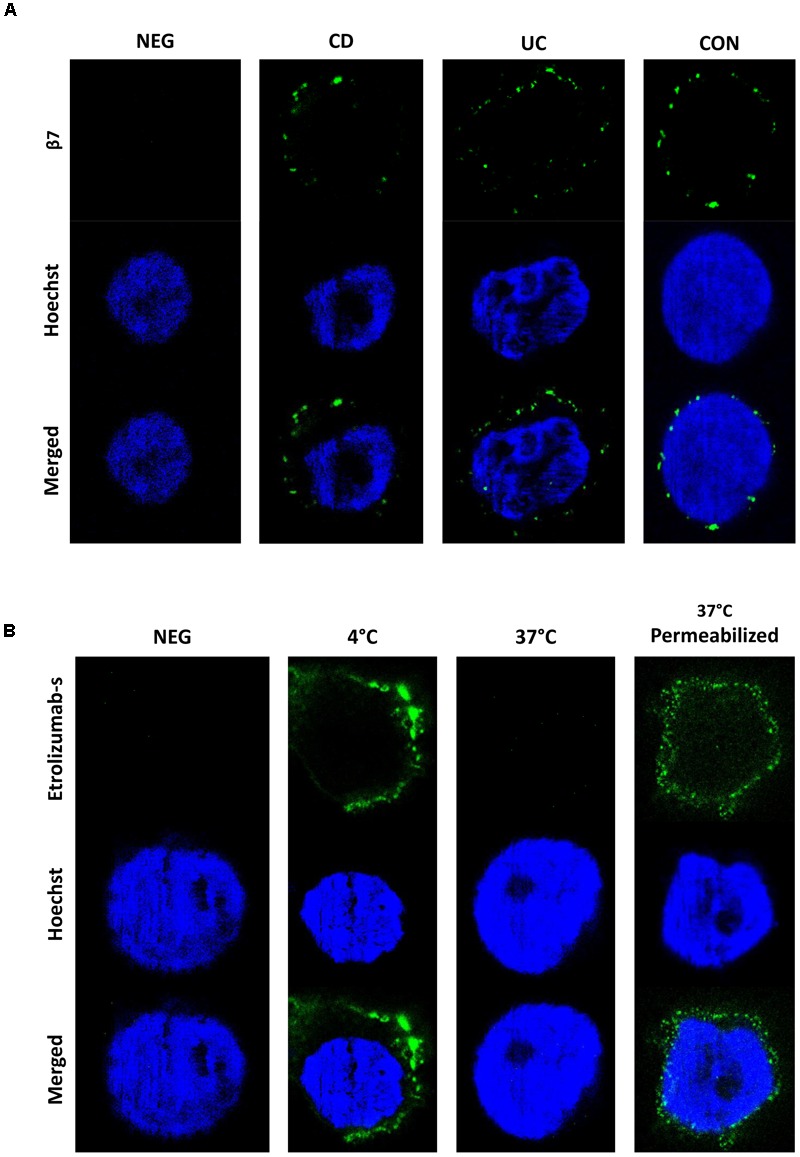
FIGURE 3.

Assessment of etrolizumab-s internalization by STED microscopy. (A) Representative STED microscopy images showing localization and distribution of β7 integrin on the surface of cells from CD, UC, and CON donors. Additionally, a negative control (NEG) without primary antibody staining is shown. Images are representative for seven independent experiments. (B) Representative images showing etrolizumab-s localization on/in cells incubated with etrolizumab-s at 4°C or cells incubated with etrolizumab-s at 37°C and additionally treated with or without Triton-X. Additionally, a negative control without primary antibody staining is shown. Images are representative for five independent experiments.
