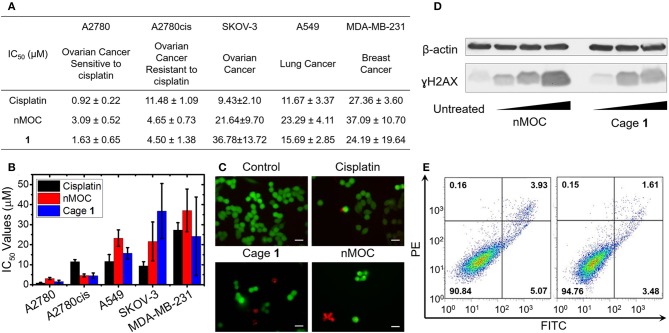
Figure 2.
Cellular responses of the metal-organic cage (1) and the nanoparticles of MOCs. (A) A table of the IC50 values of cisplatin, 1, and nMOC determined by MTT assays; (B) Bar graph of IC50 values obtained using a panel of human cancer cell lines; (C) Fluorescence microscopic images obtained for the live/dead cell assay using A2780cis cells treated with cisplatin, 1, or nMOC; (D) Immunoblotting analysis of γH2AX in A2780cis cell line; (E) Annexin V apoptosis assay using A2780cis cells treated with nMOC (left) and cisplatin (right).

