Figure 3.
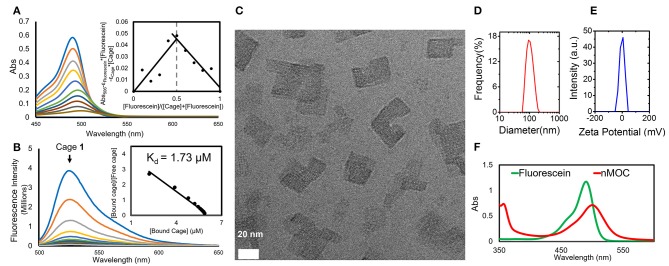
Nanoformulation of Cage 1 using fluorescein (2) and MPEG5k-PGA50 (3). (A) Quenching of fluorescence emission of fluorescein by titration with 1 (6 μM) and the Scatchard plot extracted from fluorescence titration to determine Kd; (B) Changes of the absorption spectra of the mixture of 1 and 2 in a different molar ratio (0–1.0) and the Job plot extracted from titration to determine the binding ratio of 1 and 2.; (C) A cryo-EM image (Scale bar: 20 nm) (D) DLS analysis of size distribution; (E) Zeta-potential analysis; (F) UV-vis spectra of fluorescein and nMOC in PBS ([2] = 20 μM).

