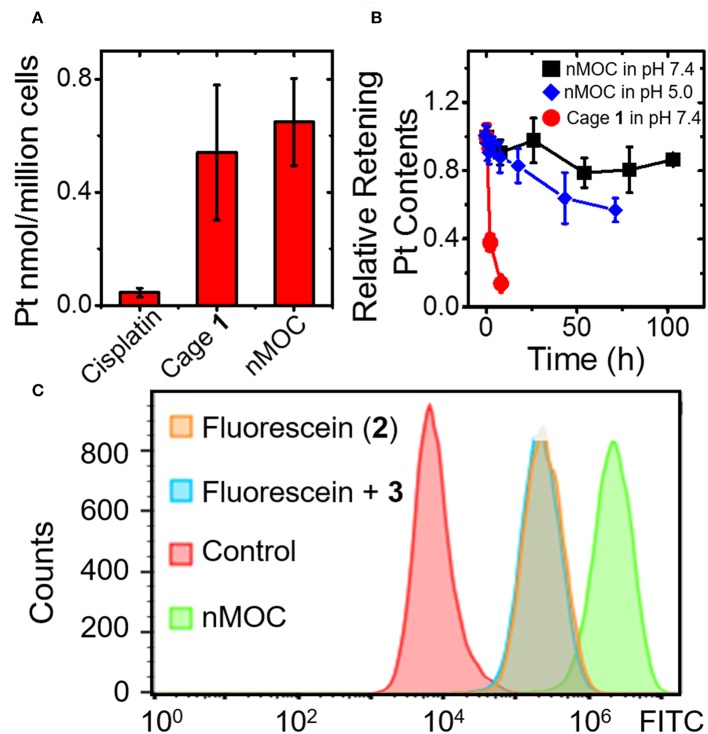
Figure 4.
Cellular uptake drug release profiles of the nanoparticles of MOCs. (A) Cellular uptake profiles of the different Pt compounds in A2780cis ovarian cancer cells analyzed by using GFAAS; (B) Drug release profile of nMOC and Cage 1 in PBS (pH = 7.4) or acetate buffer (pH = 5.0) at R.T.; (C) Cellular uptake profiles analyzed by using flow cytometry.

