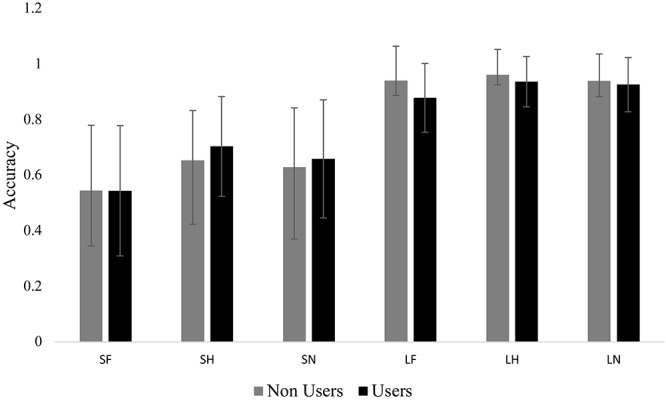
FIGURE 2.

Mean accuracy for each group in each condition. Bar graph displaying the mean accuracy scores with standard deviation bars. The short condition (i.e., masked) was significantly lower than the long condition (i.e., unmasked). There were no group differences and no differences within long and short. SF, short fear; SH, short happy; SN, short neutral; LF, long fear; LH, long happy; and LN, long neutral.
