FIGURE 3.

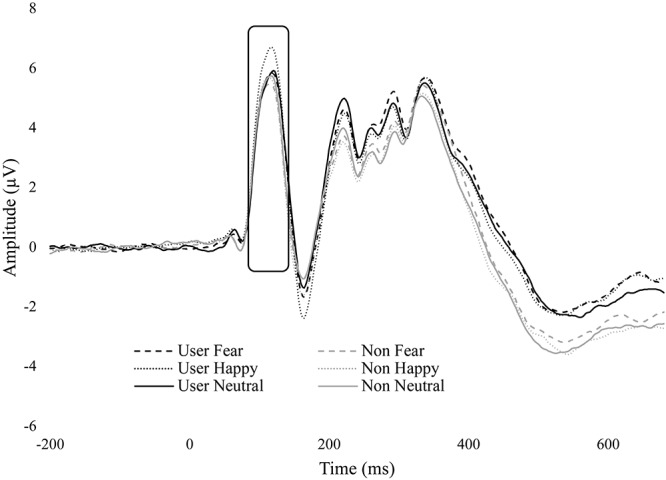
ERP wave from O2. ERP waveform from electrode O2 displaying the P1 component. Cannabis users had greater amplitude for happy.

ERP wave from O2. ERP waveform from electrode O2 displaying the P1 component. Cannabis users had greater amplitude for happy.