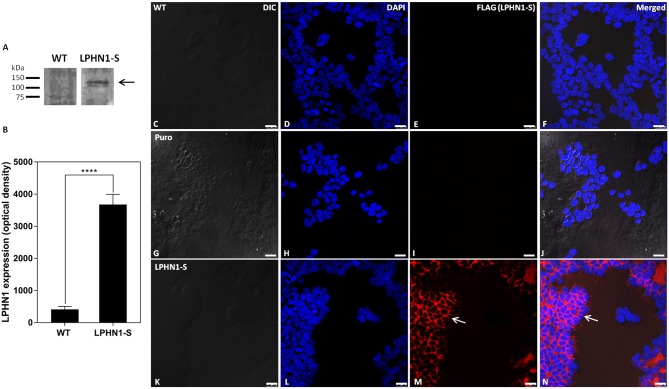
Figure 4.
HEK-LPHN1-S cells strongly express LPHN1-S, whereas HEK-WT and HEK-puro cells do not. (A) Western blot of LPHN1 expression in HEK-WT and HEK-LPHN1-S cells. A band at ~120 kDa is present in the HEK-LPHN1-S cells, but not in the HEK-WT cells (black arrow). Expected size is 116 kDa. (B) Quantification of LPHN1 protein expression in HEK-WT and HEK-LPHN1 cells. (Mean ± SEM; n = 4; ****p < 0.0001; two-tailed t-test) (C–F) Confocal images of HEK-WT cells. (G–J) Confocal images of HEK-Puro cells. (K–N) Confocal images of HEK-LPHN1-S cells. (C,G,K) DIC image. (D,H,L) DAPI staining of nuclear proteins. (E,I,M) FLAG-tagged LPHN1-S. (F,J,N) Merged images of A–C, G–I, and K–M, respectively. White arrow in M,N indicates FLAG-tagged LPHN1-S expression in HEK-LPHN1-S cells. A strong FLAG signal is seen at the cell membrane of HEK-LPHN1-S cells only, indicating strong expression of the LPHN1-S construct in this region (white arrow). HEK-WT and HEK-Puro cells showed no FLAG signal. Scale bar in all images is 25 μm.

